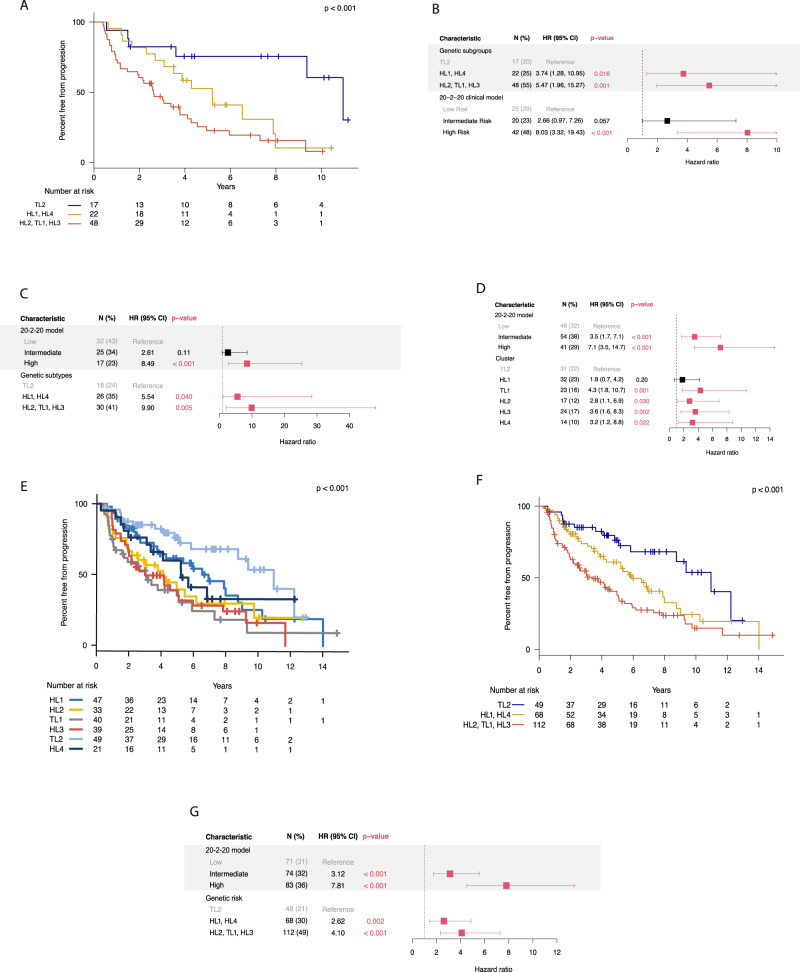
Fig. 3. Clinical outcomes of the six molecular and the risk groups in the primary and validation cohorts.
A Kaplan-Meier curves for analysis of TTP in patients (n = 87) belonging to the three genetic risk groups (Low: TL2, Intermediate: HL1, HL4, High: HL2, TL1, HL3); log-rank p value = 0.0005. B Multivariate cox regression analysis of the low, intermediate, and high-risk genetic subtypes and clinical risk stages according to the IMWG 20/2/20 model in the primary cohort (n = 87). C Multivariate cox regression analysis of the low, intermediate, and high-risk genetic subtypes and clinical risk stages according to the IMWG 20/2/20 model in the first validation cohort (n = 74). D Multivariate cox regression analysis of the genetic subtypes and clinical risk stages according to the IMWG 20/2/20 model in the two validation cohorts (n = 142). E Kaplan-Meier curves for analysis of TTP in patients from the six genetic subtypes in the combined cohort (n = 229); log-rank p value = 0.002. F Kaplan-Meier curves for analysis of TTP in patients belonging to the three genetic risk groups of the combined cohort (n = 229); log-rank p value = 0.0002. G Multivariate cox regression analysis of the low, intermediate, and high-risk genetic subtypes and clinical risk stages according to the IMWG 20/2/20 model in the combined cohorts (n = 229). Forest plots are used to visualize the multivariate analysis. IMWG International Myeloma Working Group, N number of patients with event and percentages from the total number of patients evaluable, HR hazards ratio, error bars indicate 95% CI. All p values are two-sided. Differences in survival curves and subsequent two-sided p values were calculated using the log-rank test.

