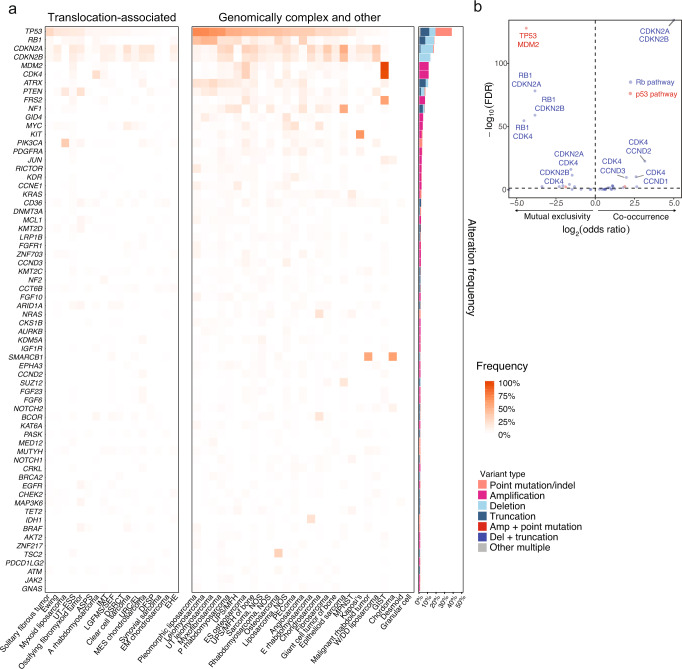
Fig. 2. Genomic landscape of sarcomas.
a Heat map showing the frequency of recurrent short variants and copy number variants in the listed genes in each subtype of sarcoma, grouped as translocation-associated or genomically complex and other sarcomas (left), as well as the types of genomic alterations (right). b Volcano plot showing co-occurrence (odds ratio >1) and mutual exclusivity (odds ratio <1) between two genes within the same pathway. Top ten significant interactions (FDR < 0.05) are labeled. UT ESS uterine endometrial stromal sarcoma, ASPS alveolar soft part sarcoma, A alveolar, IMT inflammatory myofibroblastic tumor, LGFMS/SEF low-grade fibromyxoid sarcoma/sclerosing epithelioid fibrosarcoma, DSRCT desmoplastic small round cell tumor, URC/EL undifferentiated round cell/Ewing-like, DFSP dermatofibrosarcoma protuberans, EHE epithelioid hemangioendothelioma, UT uterine, P pleomorphic, UPS undifferentiated pleomorphic sarcoma, MFH malignant fibrous histiocytoma, ES extraskeletal, NOS not otherwise specified, PEComa perivascular epithelioid cell tumor, E embryonal, MPNST malignant peripheral nerve sheath tumor, W/DD well or dedifferentiated, GIST gastrointestinal stromal tumor. Source data are provided as a Source Data file.

