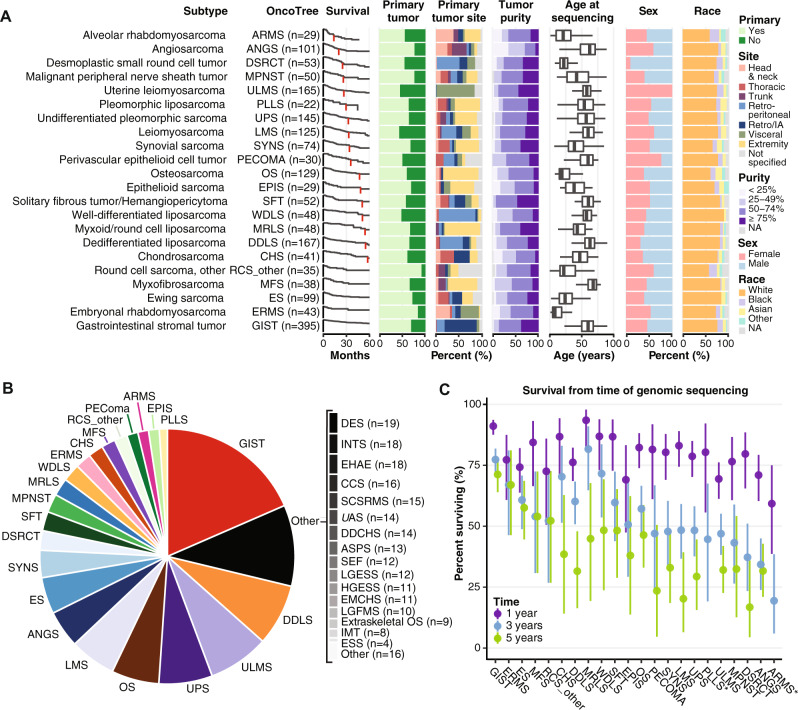
Fig. 1. Analysis of 2138 sarcoma samples reveals variation in patient characteristics among subtypes.
This analysis includes 2138 bone and soft tissue sarcoma samples, each from distinct patients. Subtypes with ≥20 samples in the dataset are displayed. A Distribution of number of samples, survival from time of sequencing, sample type (primary or metastatic site), tumor site, sample purity, age, sex, and self-reported race in each subtype. Retro/IA, retroperitoneal or intrabdominal. NA, not applicable. In the age plot, box boundaries indicate 25th and 75th percentiles, interior lines medians, and whiskers 1.5 times the interquartile range. B Overall distribution of sample number for the entire cohort. C 1, 3, and 5-year survival from the time of sequencing. *, 5-year survival = 0. Vertical lines indicate 95% confidence intervals. DES desmoid tumor, ESS endometrial stromal sarcoma, INT intimal sarcoma, LGFMS low-grade fibromyxoid sarcoma, EMCHS extraskeletal myxoid chondrosarcoma, HGESS high-grade endometrial stromal sarcoma, LGESS low-grade endometrial stromal sarcoma, SEF sclerosing epithelioid fibrosarcoma, ASPS alveolar soft part sarcoma, DDCHS dedifferentiated chondrosarcoma, UAS uterine adenosarcoma, SCSRMS spindle cell/sclerosing rhabdomyosarcoma, CCS clear cell sarcoma, EHAE epithelioid hemangioendothelioma.

