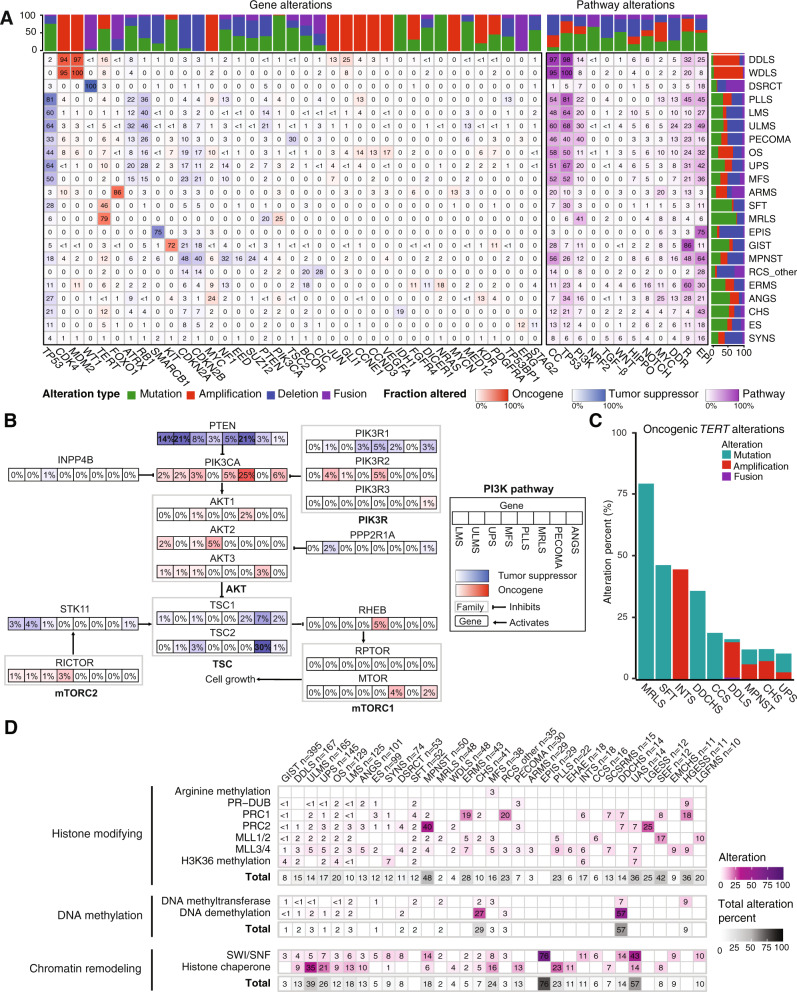
Fig. 4. Integrated pathway analysis.
A Oncogenic alterations within each of 12 pathways with relevance to cancer biology in each subtype. Numbers in each cell indicate percentage of samples harboring alterations. Stacked bar graphs indicate the distribution of the type of oncogenic alteration per gene or pathway (top) or subtype (right). CC, cell cycle; DDR, DNA damage repair; EPI, epigenetic. B PI3K pathway alterations in specific subtypes. The percentage of samples with an alteration in a specific gene in each subtype is indicated in each box. C Oncogenic TERT alterations in each of the 9 most altered subtypes. D Oncogenic epigenetic pathway alterations by subtype, grouped by complex and/or biochemical function of the encoded protein. Totals include all alterations in genes that belong to a parent category, not only those affecting specific complexes listed.

