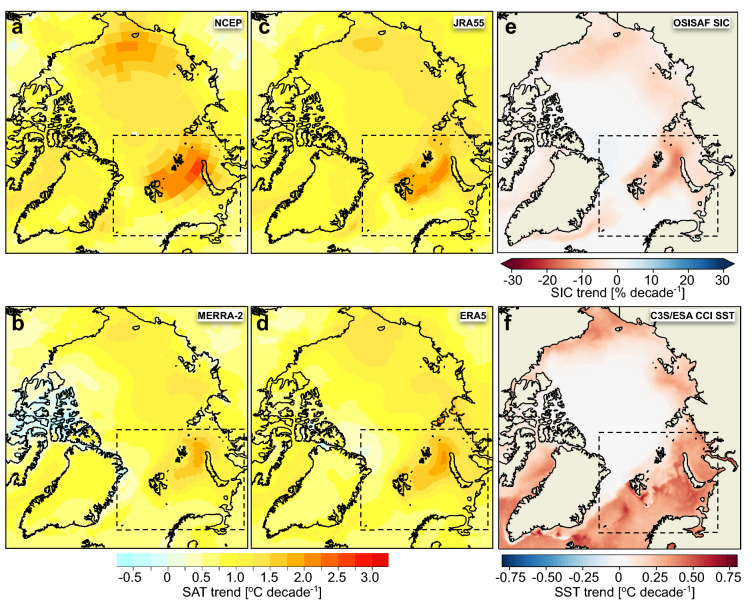
Figure 1.
Spatial pattern of the Arctic warming and sea ice decline. (a)–(d) show trends in annual SAT (°C/decade) during the 1981–2020 period derived from various reanalyses sources (see Methods) that have been widely used for the Arctic: (a) NCEP-reanalysis, (b) MERRA-2, (c) JRA55 and d) ERA5. (e), (f) show annual trends in SIC (%/decade) and SST (°C/decade) (EUMETSAT OSI SAF, C3S/ESA SST CCI). The Barents study area is marked with dotted lines. We used the esd R-package (https://doi.org/10.5281/zenodo.29385) to create the maps in (a–d). The maps in (e–f) were generated using Python 3.6 (http://www.python.org) including pyresample 1.19 and cartopy 0.18.

