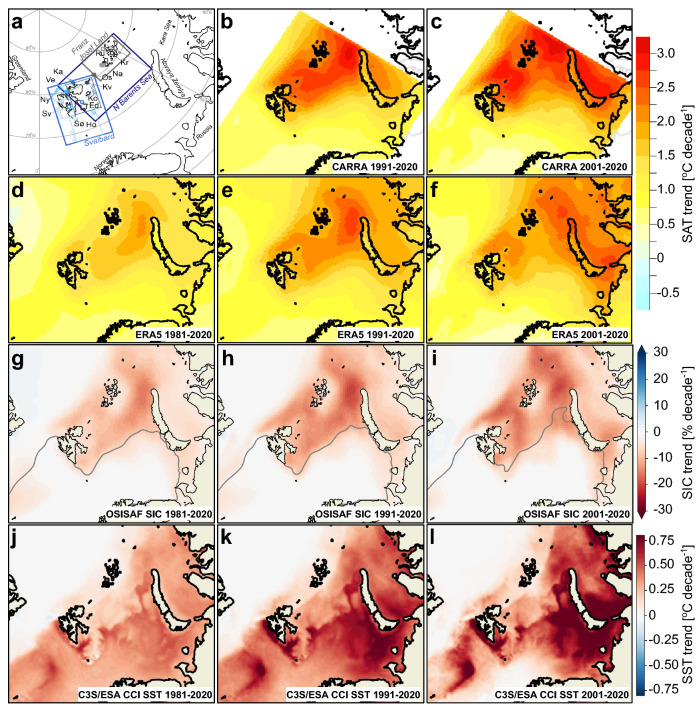
Figure 2.
The spatial pattern of changes in surface air temperature, sea ice and sea surface temperature in the Barents study area for the time periods 1981–2020, 1991–2020 and 2001–2020. (a) Barents study area including the 13 weather stations which are shown with symbols and the first two letters of the station name from Fig. 3b (for larger map and more details, see Fig. S1). The regional boxes used for time series analyses (Table 1 and 3) are marked on the map, including the four Svalbard sub-regions. (b)–(f) Annual SAT trends (°C/decade) derived from CARRA and ERA5. Please note that the results are mapped onto different grid resolutions. (g)–(i) Annual trends in SIC (%/decade) with mean 15% SIC (ice edge) contour line marked in grey, and (j)–(l) present the annual SST trends (°C/decade) during the three periods. We used the esd R-package (https://doi.org/10.5281/zenodo.29385) to create the maps in b-f. The maps in a, g-l were generated using Python 3.6 (http://www.python.org) including pyresample 1.19 and cartopy 0.18.

