Figure 3.

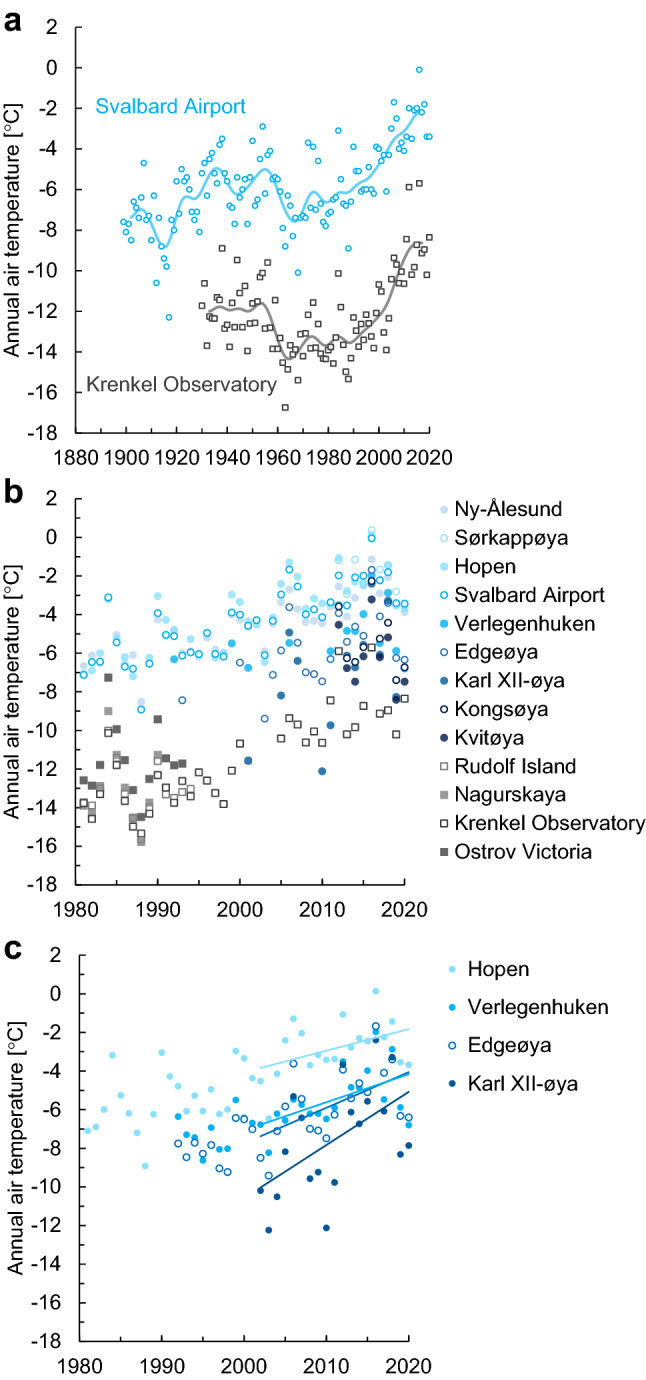
Temperature series from weather stations and observed trends. (a) Annual SAT series from the manned stations at Svalbard Airport24,31 and Krenkel Observatory38. (b) Annual SAT 1981–2020 from both old and newly available observations from Norwegian (in blue) and Russian (in grey) weather stations. (c) The new SAT series from the automatic weather stations at Verlegenhuken, Edgeøya, and Karl XII-øya compared with the manned station at Hopen. The data in a were filtered by a Gaussian filter with a standard deviation of three years, which illustrates variability at a decadal scale. In c linear trends for the 2001–2020 period are shown as solid lines. Values for the linear trends and statistical significance can be found in Table 1.
