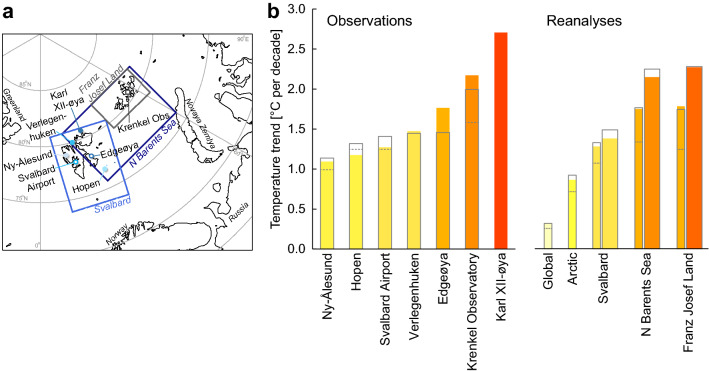
Figure 7.
Temperature trends based on instrumental observations and ERA5 and CARRA reanalyses. (a) The location of the main stations and main regions in the study. (b) Linear trends for annual SAT series and reanalyses for the period 2001–2020. Bar colours follow the colour scale for SAT in Fig. 2. If available, the SAT trends over the 1981–2020 and 1991–2020 periods are additionally shown as dotted and solid grey line bars, respectively. On the right hand side of the bar plots, the ERA5 and CARRA reanalyses are shown as thin and thick bars, respectively. In addition, SAT trends for ERA5 for the Arctic (i.e. north of 65° latitude) and global mean are shown. The map in a was generated using Python version 3.6 (http://www.python.org) including pyresample 1.19.

