Figure 1.
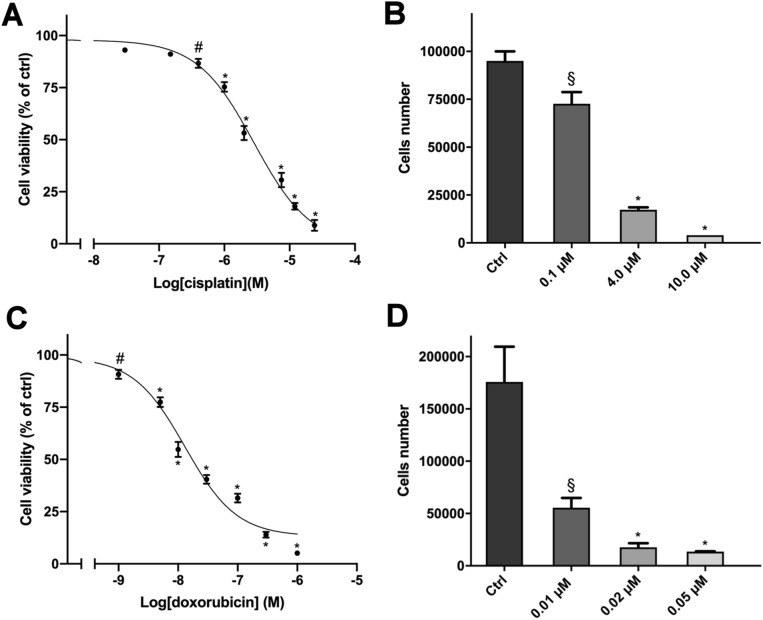
Cytotoxic effect of cisplatin and doxorubicin in hTERT cells. (A) Concentration–response curve of cisplatin-induced inhibition of cell viability. Cells were treated with increasing concentrations of cisplatin (0.03–24 µM) for 4 days. (B) Effect of cisplatin on cell proliferation. Cells were treated for 4 days with three concentrations of cisplatin. (C) Concentration–response curve of doxorubicin-induced inhibition of cell viability. Cells were treated with increasing concentrations of doxorubicin (0.001–1 µM) for 4 days. (D) Effect of doxorubicin on cell proliferation. Cells were treated for 4 days with three concentrations of doxorubicin. Cell viability was evaluated by MTT assay while cells proliferation was assessed after cells count with trypan blue exclusion. Data are shown as mean ± SEM [*p < 0.0001; #p < 0.01; §p < 0.05].

