Figure 2.
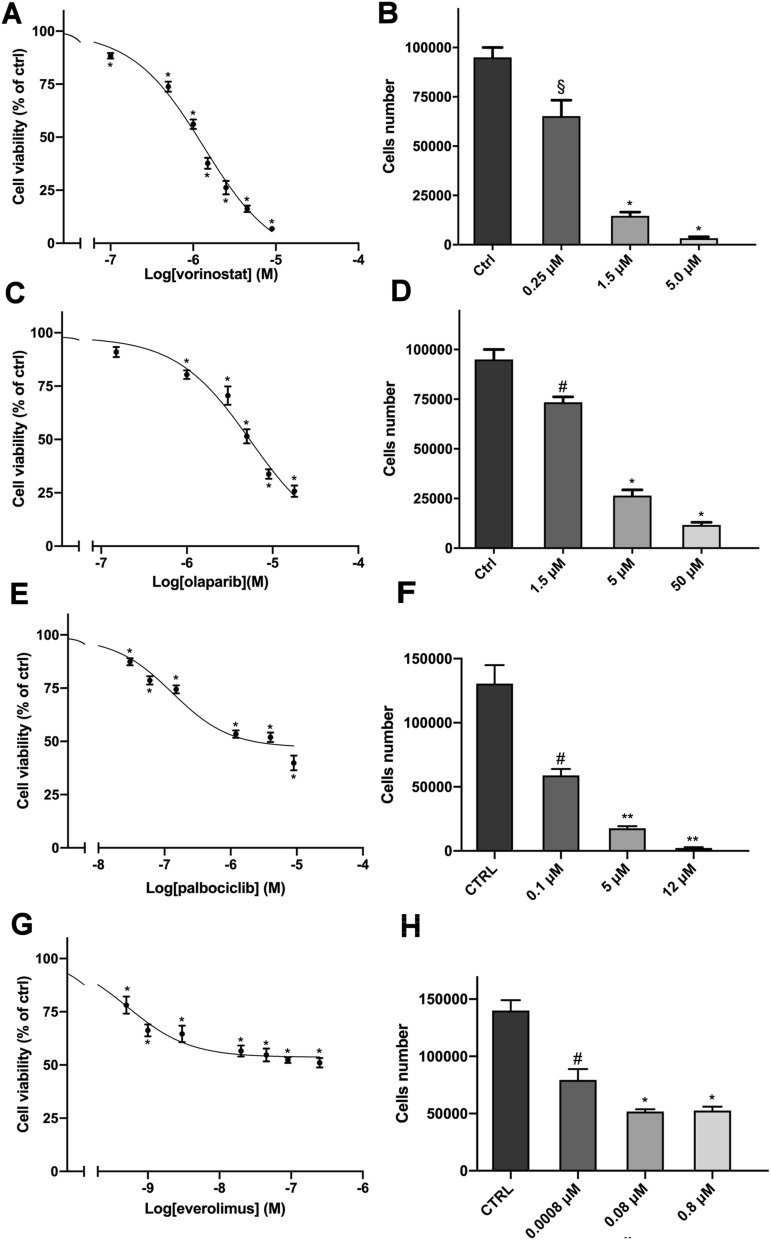
Cytotoxic effect of target therapy drugs in hTERT cells. (A,C,E,G) Concentration–response curves of vorinostat-, olaparib-, palbociclib- and everolimus-induced inhibition of cell viability. Cells were treated with increasing concentrations of vorinostat (0.1–9 µM) or olaparib (0.15–18 µM) or palbociclib (0.03–9 µM) or everolimus (0.5–250 nM) for 4 days. (B,D,F,H) Effect of vorinostat, olaparib, palbociclib and everolimus respectively, on cell proliferation. Cells were treated for 4 days with three concentrations of each drug. Cell viability was evaluated by MTT assay while cells proliferation was assessed after cells count with trypan blue exclusion. Data are shown as mean ± SEM [*p < 0.0001; ** p<0.001; #p < 0.01; §p < 0.05].

