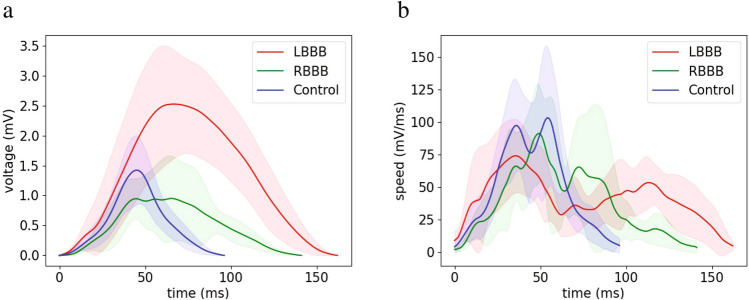
Figure 1.
Population-wise kinetics of voltage and speed signals for left and right bundle branch block (LBBB and RBBB) compared with control patients. Signal lengths were normalized to the mean length to obtain the average signal for each condition. Shaded areas represent the standard deviation. (a) Voltage over time signals for control subjects (blue, n = 49), patients with right bundle branch block (RBBB, green, n = 9) or left bundle branch block (LBBB, red, n = 8) obtained from the PTB database. LBBB signals show higher voltage values and signal duration as compared with controls or RBBB. (b) Vector speed over time for the same three conditions. LBBB and RBBB signals show slower movement through the vector field as compared with controls. The figure was created using Python’s Matplotlib library (v.3.4.2.)37.

