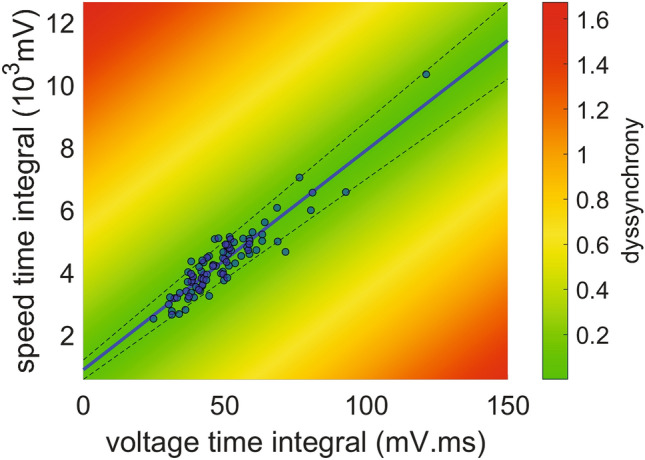
Figure 2.

Heatmap showing the dyssynchrony index and the VCG-based time integral of voltage as well as speed from healthy individuals. Vector speed time integral (STI) plotted against vector voltage time integral (VTI) for 90 control individuals. The blue line is the linear fit of the data (r2 = 0.86, dotted lines: 95% confidence interval). The line’s slope represents the tissue characteristic time (70.28 ms−1). The colour bar highlights the dyssynchrony index as defined in the Methods section. The figure was created using MATLAB R2019b (https://www.mathworks.com/).
