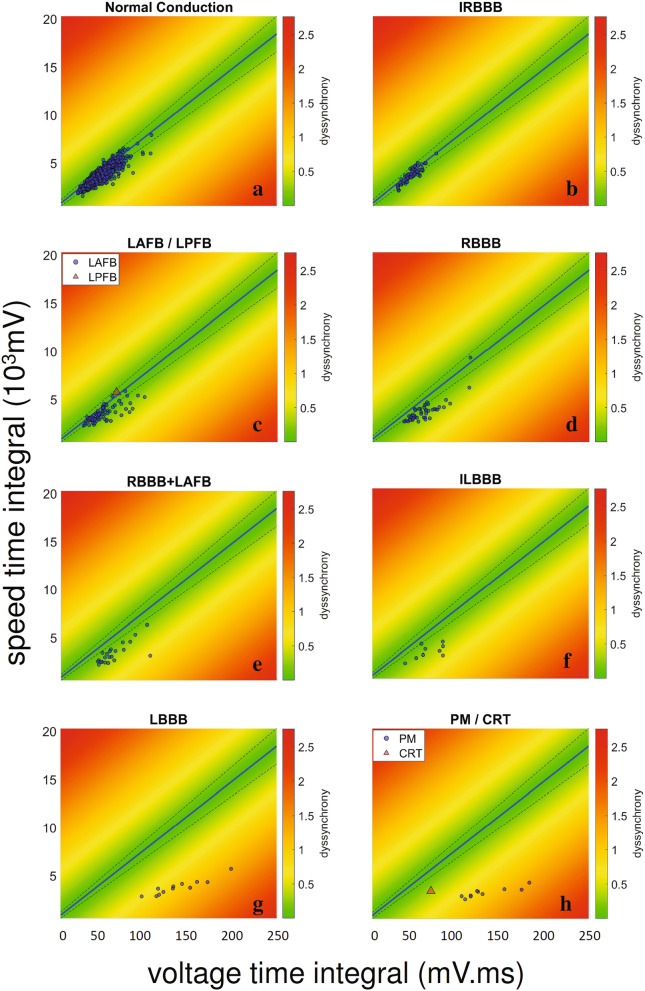
Figure 3.
Heatmap showing the dyssynchrony index and the VCG-based time integral of voltage as well as speed for different conduction patterns in a heterogeneous population (local BH database). Each dot represents one patient, the blue line is the linear fit for the control population (Fig. 2) and dashed lines contain the 95% confidence interval (CI). Colorbar represent the value of the dyssynchrony index. Each patient was classified in its conduction pattern category by two cardiologists. Speed time integral (STI) vs. voltage time integral (VTI) plot for ECGs classified as normal conduction (a, n = 1672), incomplete right bundle branch block (IRBBB, b, n = 63), left anterior/left posterior fascicular flock (LAFB/LPFB, c, n = 78), complete right bundle branch block (RBBB, d, n = 47), right bundle branch block plus left anterior fascicular block (RBBB + LAFB, e, n = 22), incomplete left bundle branch block (ILBBB, f, n = 9), complete left bundle branch block (LBBB, g, n = 12) and pacemaker/cardiac resynchronization therapy (PM/CRT, h, n = 11). The figure was created using MATLAB R2019b (https://www.mathworks.com/).

