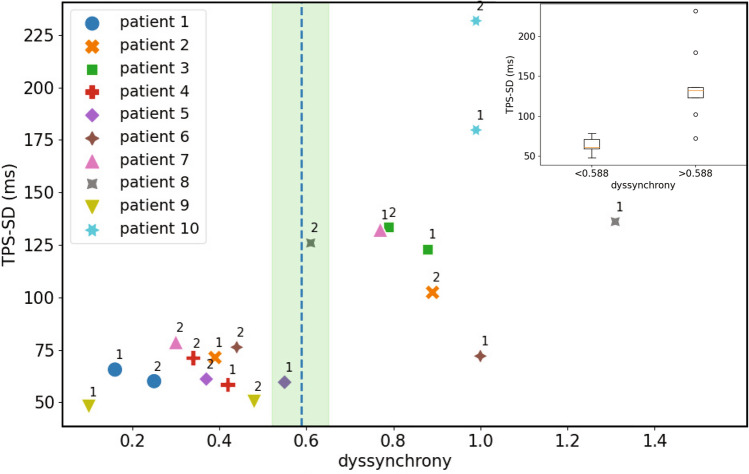
Figure 4.
Simultaneous quantification of mechanical dyssynchrony and the dyssynchrony index. Standard deviation of the time to peak strain (TPS-SD) plotted against the dyssynchrony index. The marker styles represent different patients, 1 and 2 represent the ventricular stimulations denoted in Table 1. Green shaded area and blue vertical dashed line indicate, respectively, the range (0.519–0.657) and average (0.588) of the optimal cut-off values determined by using a logistic regression analysis (see the Methods section, subsection Statistical Methods and Fig. S5). Inset: Box plot showing TPS-SD for 10 patients (20 pacing configurations) grouped according to the average cut-off value for the dyssynchrony index (p = 0.00031). The figure was created using Python’s Matplotlib library (v.3.4.2.)37.

