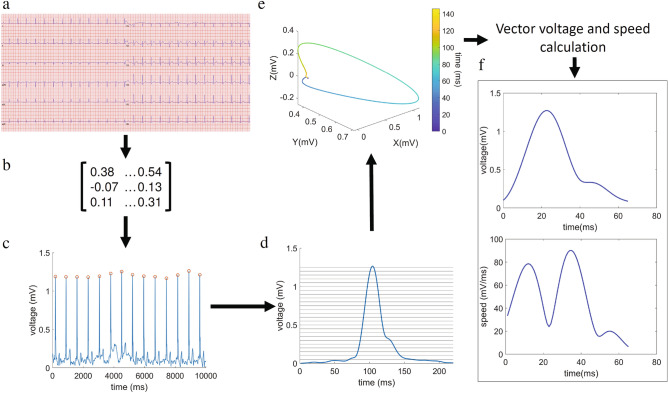
Figure 6.
ECG-derived VCG extraction algorithm and calculation of instantaneous vector voltage and speed kinetics. (a) Raw ECG data is loaded into the program as input. (b) Kors transformation matrix is applied to the raw data. (c) Peaks are identified along the voltage (spatial vector magnitude) over time signal. (d) Patient mean depolarization signal (peak-aligned) limits are identified by a custom adaptive threshold method. (e) VCG extraction (colour bar representing time in ms). (f) Instantaneous voltage and speed signals over time are obtained. The figure was created using MATLAB R2019b (https://www.mathworks.com/).

