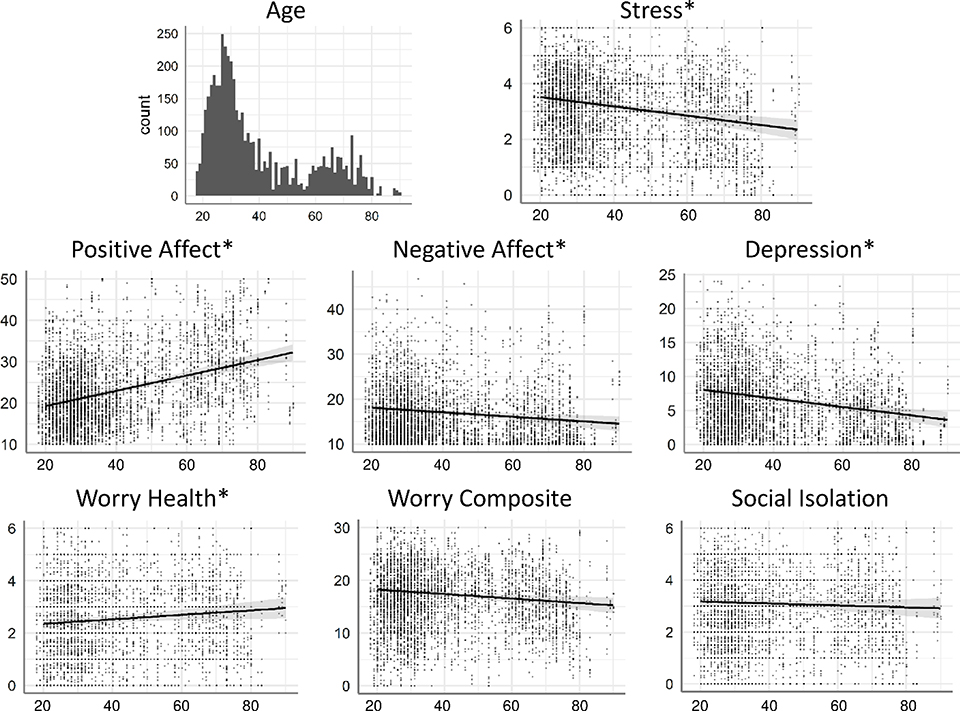
Figure 2. Effects of age.
The histogram at the top left shows the distribution of age among participants included in the main analysis. For all other plots, age is on the x-axis and score on each DV is on the y-axis. The dots show raw data averaged across time bins (darker dots represent overlapping data points). Lines show the marginal effect of Age and the 95% confidence interval from the Age x Time Bin mixed models (see Methods). Asterisks indicating DVs with a significant effect of age.

