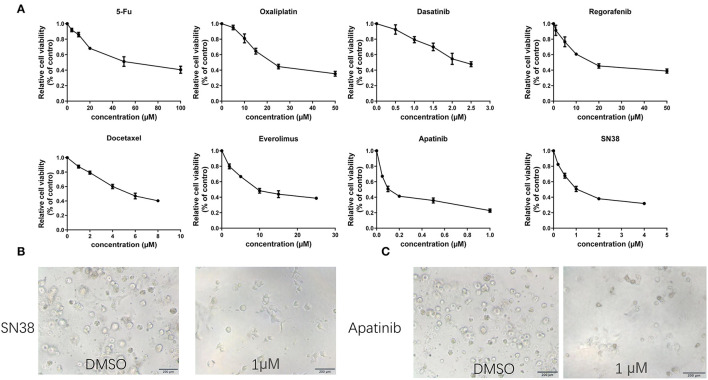
Figure 5.
Representative images and drug tests of the organoids. (A) Dose-response curves of organoids treated with 5-FU, oxaliplatin, SN38, apatinib, dasatinib, docetaxel, regorafenib and everolimus. (B) Mean ± SD of results from three independent experiments is shown for each drug. (C) Representative images of the organoid after treatment with 1 μM SN38 and DMSO. Organoid treated with 1 μM apatinib and DMSO. Scale bar = 200 μm.

