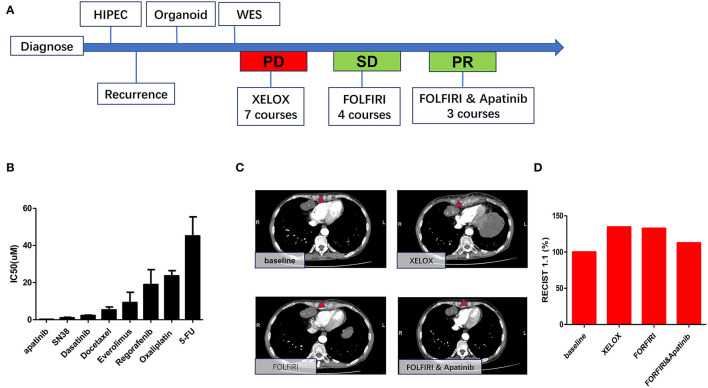
Figure 6.
Consistency between organoid and patient responses to different drugs. (A) Timetable of disease progression. (B) Drug sensitivity data indicating low sensitivities to 5-fu and oxaliplatin and high sensitivities to apatinib and SN38. (C) Representative CT images of heart diaphragm angle lymph node after treatment. (D) Sum of the length and width of heart diaphragm angle lymph node after treatment with XELOX, FORFIRI, and FORFIRI and apatinib, red bars indicate volume of the target metastasis [according to RECIST 1.1].

