Figure 4.
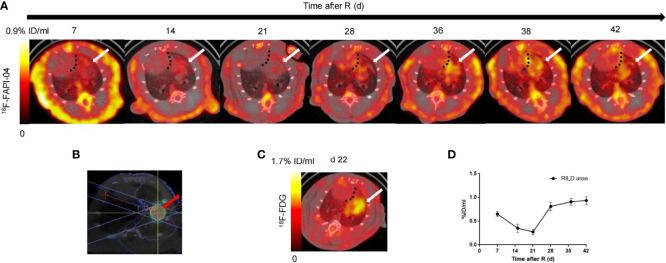
In vivo imaging of 18F-NOTA-FAPI uptake in longitudinal study. (A) Static PET/CT matched axial slices from the same rat subjected to radiation and scanned 1 h after injection of 18F-FAPI on days 7, 15, 21, 28, 36, 38 and 42 after radiation treatment. Dashed lines separate tracer uptake in lung from uptake in heart, and white arrows show representative regions of interest (2-dimensional) drawn over area of RILD. (B) On the cross section, a schematic diagram of the radiation target (red arrow) of the right lung of rats, an arc field were used to irradiate the lung in a targeted way with a homogeneous dose. (C) Static PET/CT matched axial slices in the same rat scanned 1 h after injection of 18F-FDG on day 22 after radiation treatment. (D) Corresponding time–activity curves for RILD from day 7 to day 42 after radiation (average and SD, n = 3).

