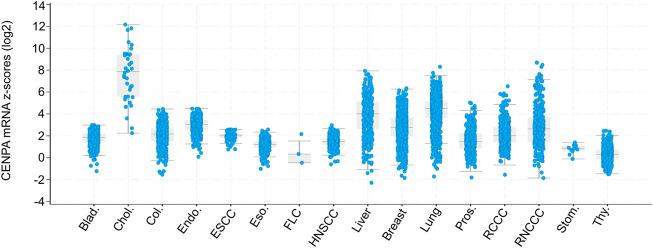
FIGURE 2.
Box and dot plots indicating CENPA expression in patient tumors relative to normal samples (z-score, log2 RNA SeqV2 RSEM). Modified from Jeffery et al., 2021 . Box and dot plots indicating CENPA mRNA expression levels in patient tumors relative to normal samples (z-score, log2 RNA SeqV2 RSEM) from cBioPortal (TCGA PanCancer Atlas studies) (Cerami et al., 2012; Gao et al., 2013). The plot was generated using the cBioPortal web interface. X-axis indicates Cancer Type: Bladder Urothelial Carcinoma (Blad.), Cholangiocarcinoma (Chol.), Colorectal Adenocarcinoma (Col.), Endometrial Carcinoma (Endo.), Esophageal Squamous Cell Carcinoma (ESCC), Esophagogastric Adenocarcinoma (Eso.), Fibrolamellar Carcinoma (FLC), Head and Neck Squamous Cell Carcinoma (HNSCC), Hepatocellular Carcinoma (Liver), Invasive Breast Carcinoma (Breast), Non-Small Cell Lung Cancer (Lung), Prostate Adenocarcinoma (Pros.), Renal Clear Cell Carcinoma (RCCC), Renal Non-Clear Cell Carcinoma (RNCCC), Undifferentiated Stomach Adenocarcinoma (Stom.), Well-Differentiated Thyroid Carcinoma (Thy.). TCGA: The Cancer Genome Atlas.

