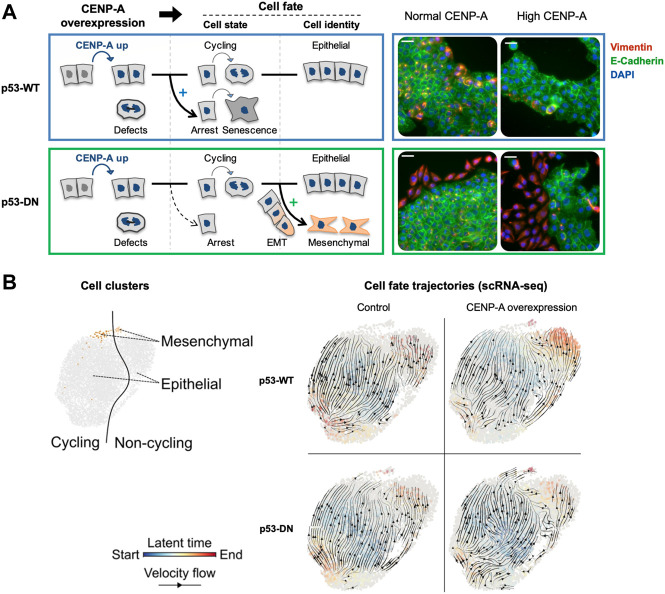
FIGURE 4.
CENP-A overexpression promotes distinct cell fates depending on p53 status. Modified from Jeffery et al., 2021 . (A) Scheme summarizing the consequences of CENP-A overexpression (in blue) on cell state and identity, in wild-type p53 (p53-WT, top panel blue) and p53-defective cells (p53-DN, dominant negative, bottom panel green). IF images show representative max intensity projections after 34 days with or without continuous CENP-A overexpression. DAPI (blue), E-cadherin (green, epithelial marker), and vimentin (red, mesenchymal marker). Scale bars = 40 µM. (B) Cell fate trajectories inferred by RNA velocity analysis of scRNA-seq samples. RNA velocities (black arrows) were calculated for each condition by stochastic modeling in individual samples. Each cell is colored by the estimated latent time from initial (blue, start) to terminal states (red, end).

