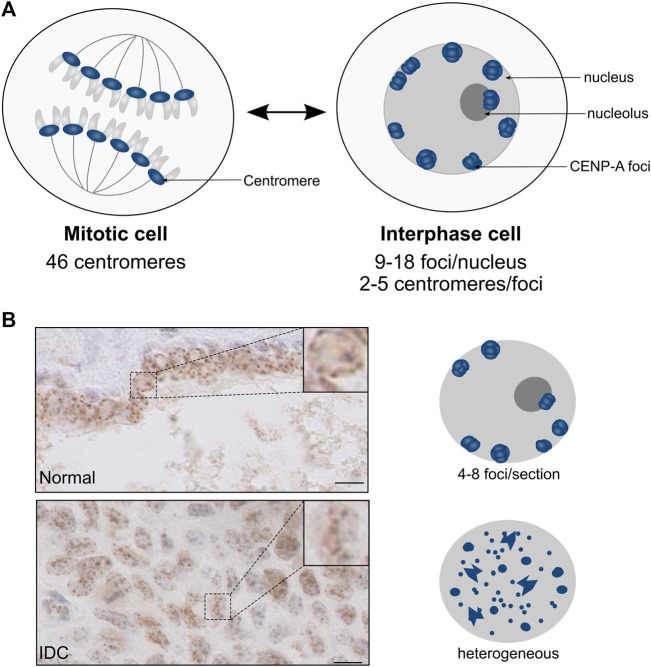
FIGURE 5.
CENP-A localization patterns in normal tissues and neoplastic lesions. Modified from Verrelle et al., 2021. (A) Schematic representation of nuclei from mitosis (left) and interphase (right) cells. In interphase cells, the clustering of centromeric CENP-A-enriched regions (blue) gives rise to CENP-A foci at the periphery of the nucleus and, in fewer cases, of the nucleolus. (B) CENP-A localization patterns visualized by IHC in breast tissues. Top: Normal duct; Bottom: Invasive Ductal Carcinoma (IDC). The boxed area shows the magnification of a representative nucleus. Scale bar = 10 µM. On the right is shown a schematic representation of the CENP-A localization pattern, with CENP-A foci (blue) within the nucleus (grey).

