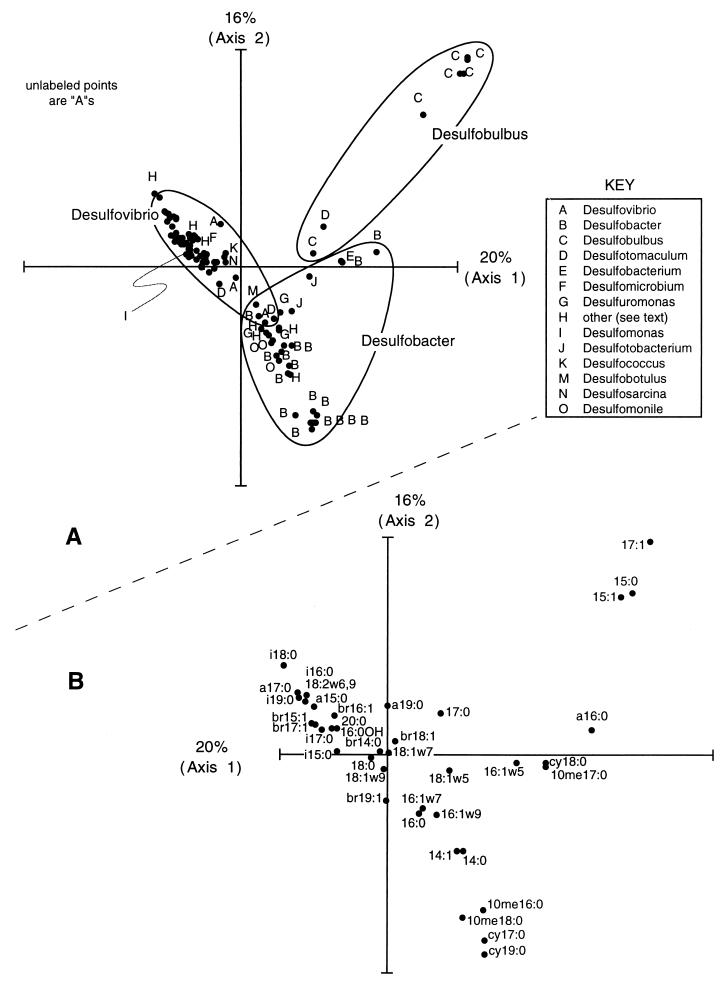
FIG. 7.
(A) CA ordination of PLFA abundance data for sulfate-reducing bacterial isolates. Samples which are plotted close together have similar PLFA compositions. Strains included in the “other” category (H) are given in the text. Ellipsoids drawn on the plot are meant to aid in identifying isolates of the same genus. (B) CA ordination scores for PLFA variables in the pure culture database. The expected abundance of each fatty acid decreases with distance from its location in the plot. Fatty acids which are plotted close to samples in panel A when plot origins are superimposed are likely to have a high relative abundance in those samples.

