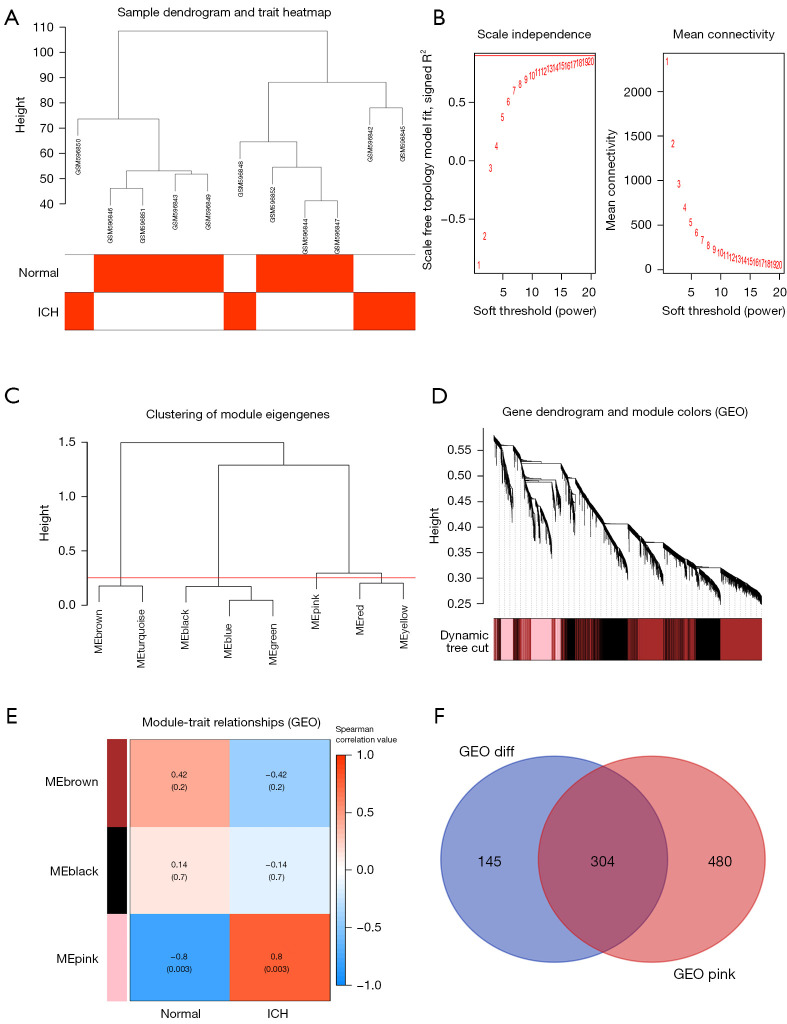
Figure 4.
WGCNA selection module and selection of differential co-expressed genes. (A) Outliers were detected in the sample cluster. (B) The cut-off point was set as 0.9, and the soft threshold power was set as β=18. (C) Correlation diagram between modules obtained by clustering according to inter-gene expression levels. (D) Tree diagram of all differentially expressed genes based on the cluster of difference measurement. The colored bands show the results from the automated monolithic analysis. (E) Heat map of the correlation between module characteristic genes and phenotypes. We chose the MEpink module for subsequent analysis (the ordinate value is the correlation coefficient of feature module). (F) The intersection gene of ICH differentially expressed genes and the MEpink module. WGCNA, weighted gene co-expression network analysis; diff, differentially expressed gene.

