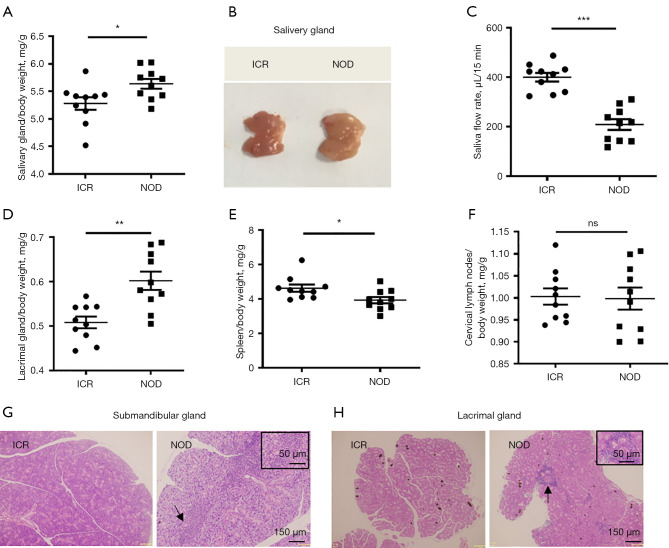
Figure 1.
SS-like symptoms in NOD mice. (A) The salivary gland/body weight increased in 8-week-old NOD/Ltj mice. (B) The general view of the salivary glands of ICR and NOD/Ltj mice. (C) The saliva flow rates in ICR and NOD/Ltj mice. (D-F) The lacrimal gland, spleen and cervical lymph nodes/body weight were compared between ICR and NOD/Ltj mice. Lymphocytic infiltration in submandibular glands (G) and lacrimal glands (H) were evaluated with H&E staining in NOD/Ltj and ICR mice. Values were derived from 3 separate experiments. (n=10, *, P<0.05; **, P<0.01; ***, P<0.001; ns, no significance). The black arrows indicate lymphocytic infiltration. The 150 µm scale stands for the whole staining image, while 50 µm scale stands for the small staining image with higher magnification to better see the inflammatory infiltration. SS, Sjögren’s syndrome; ICR, Institute of Cancer Research; NOD, non-obese diabetic; H&E, hematoxylin and eosin.

