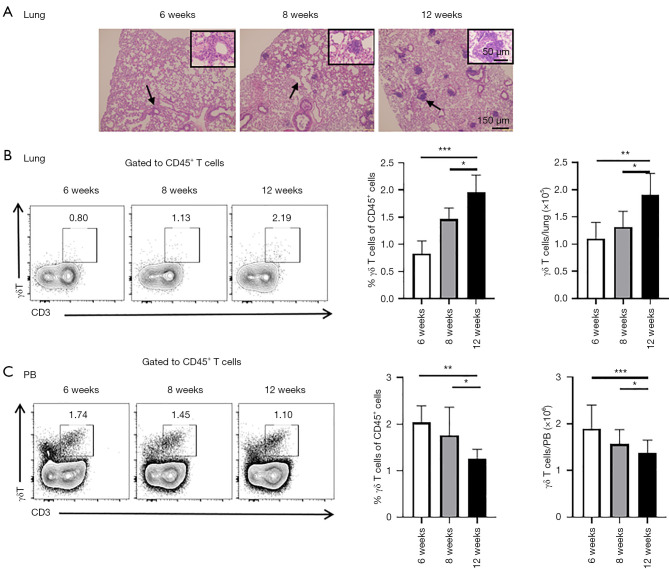
Figure 2.
Lymphocytic infiltration and γδ T cells in lungs of NOD mice. (A) Lymphocytic infiltration in the lungs of NOD/Ltj mice at 6, 8, and 12 weeks, stained with H&E. (B) Flow cytometry showed the proportion and number of γδ T cells in the lung. (C) Flow cytometry showed the proportion and number of γδ T cells in peripheral blood. (n=10, *, P<0.05; **, P<0.01; ***, P<0.001). The black arrows indicate lymphocytic infiltration. The 150 µm scale stands for the whole staining image, while 50 µm scale stands for the small staining image with higher magnification to better see the inflammatory infiltration. PB, peripheral blood; NOD, non-obese diabetic; H&E, hematoxylin and eosin.

