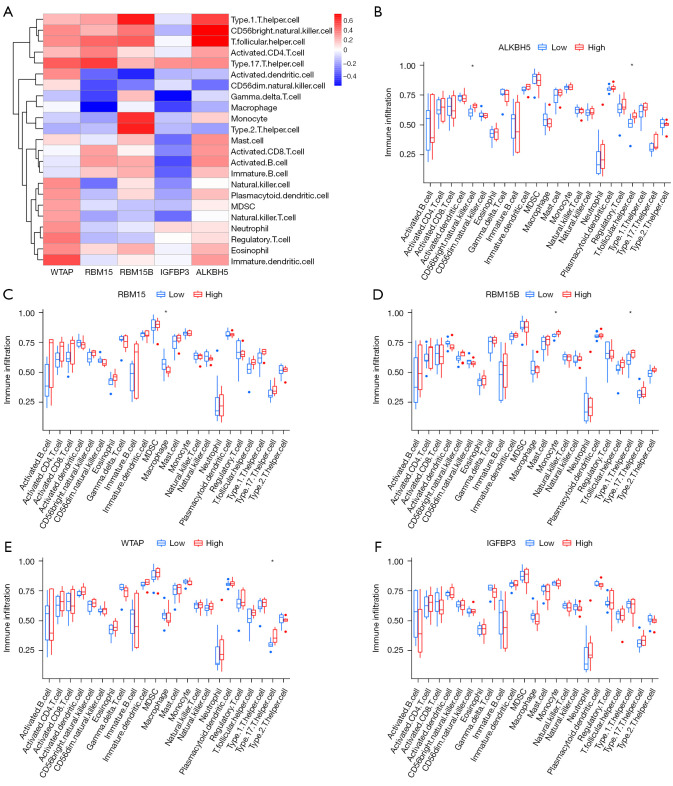
Figure 6.
Immune cell infiltration. (A) Heat map of the correlation between the expression of the five m6A methylation regulators and immune cells infiltration by the ssGSEA method. (B) ALKBH5 was positively correlated with CD56 bright natural killer cells and T follicular helper cells, *P<0.05. (C) RBM15 was negatively correlated with macrophages. *P<0.05. (D) RBM15B was positively correlated with monocytes and type 1 T helper cells. *P<0.05. (E) WTAP was positively correlated with type 17 T helper cells. *P<0.05. (F) IGFBP3 levels were not statistically significantly correlated with immune cell infiltration.

