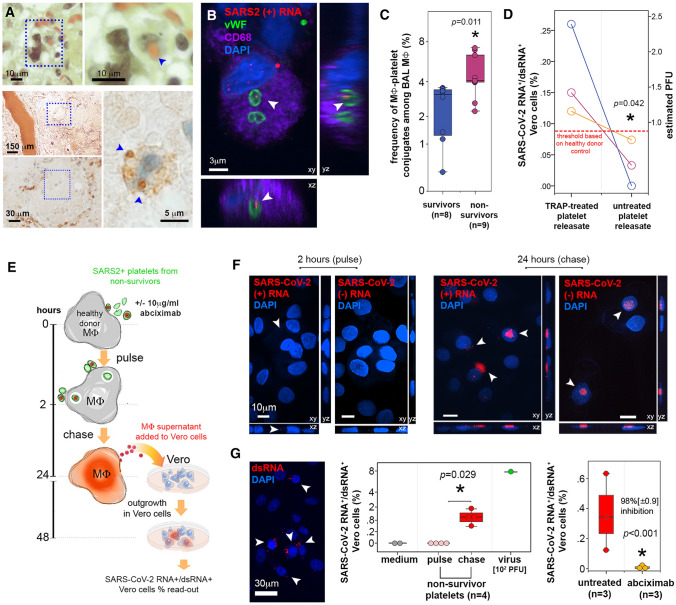
Fig. 4.
SARS-CoV-2 sheltered by platelets from non-survivor patients with COVID-19 is infectious to macrophages. A Upper row: Hematoxylin/eosin/saffron stain histology of representative lung tissue autopsy of COVID-19 patients showing a macrophage, indicated by dotted square region (left) in the process of phagocytosing a red blood cell as shown in higher magnification (right, blue arrowhead). Bar = 10 μm. Lower panel: Immunohistochemistry for vWF of alveoli from non-survivor lung autopsy (indicated by blue dotted square at low magnification, bar = 150 μm) where a macrophage (indicated by blue dotted square at middle magnification, bar = 30 μm) contained hemophagocytosed vWF+ platelets (blue arrowheads in high magnification image, bar = 5 μm). B Representative confocal microscopy images after vWF (green) and CD68 (purple) immunolabeling and SARS-CoV-2 RNA in situ hybridization (red) for positive (+) RNA strand in BAL samples from COVID-19 non-survivors. Images show three-dimensional projections (xy, xz and yz, bar = 3 μm). Arrowheads indicate SARS-CoV-2 RNA inside platelets engulfed by macrophages (representative of n = 3 different individuals). C Frequency of macrophage-platelet conjugates among macrophages in bronchoalveolar lavage samples from COVID-19 survivors (blue) and non-survivors (magenta) detected by flow cytometry. Asterisk indicates statistical significance in the comparison between survivors and non-survivors (Mann–Whitney). D Paired comparison of percentages of SARS-CoV-2 RNA+/dsRNA+ Vero cells treated with releasate from platelets treated or not with TRAP, from 3 different non-survivors. The detection threshold (dotted red line) was established with healthy donor platelets treated equally. The percentages were converted in PFU per million platelets using the standard curve we established. Mann–Whitney test. The estimated mean PFU per million platelets is shown in blue, with 95% confidence intervals. E Scheme of the experiments evaluating platelet-mediated SARS-CoV-2 transfer of infection to macrophages in vitro. SARS-CoV-2 -containing platelets from non-survivors interacted with macrophages in the presence or absence of abciximab (anti-GpIIbIIIa) for 2 h (pulse) followed by 24-h chase. At these time-points, macrophages harboring (+) and (-) SARS-CoV-2 RNA were enumerated by in situ hybridization and macrophage supernatants were collected and further evaluated for infectious virus content in reporter Vero cells. SARS-CoV-2 RNA+/dsRNA+ Vero cells were detected by in situ hybridization and quantified by FISH-flow. F Confocal microscopy images of SARS-CoV-2 RNA in situ hybridization (red) for positive (+) and negative (-) strand RNA in macrophages that interacted in vitro with platelets samples from COVID-19 non-survivors. Images were acquired after 2 h (pulse, left) or 24 h (chase, right) of interaction with platelets. Images show three-dimensional projections (xy, xz and yz, bar = 10 μm). Arrowheads indicate SARS-CoV-2 RNA. Macrophage nuclei are stained with DAPI (blue). G Outgrowth in Vero reporter cells of SARS-CoV-2 produced by macrophages after platelet-mediated infection. On the left, confocal microscopy image of double-strand RNA (dsRNA, red) in Vero cells cultivated with macrophage supernatants for 24 h. Arrowheads indicate infected Vero cells (bar = 30 μm), Vero cells nuclei are stained with DAPI (blue). On the middle graph, infected Vero cells were quantified by FISH-flow and expressed as % of SARS-CoV-2 RNA+/dsRNA+ Vero cells, comparing negative controls (medium, gray = non-infected Vero), positive controls (virus, green = primary SARS-CoV-2 obtained from patient bronchoalveolar lavage) and COVID-19 non-survivors platelets after pulse (2 h interaction with macrophages, light red) and chase (24 h after interaction with macrophages, red). Asterisk indicates statistical significance in the comparison between pulse and chase (Mann–Whitney). The right graph shows the outgrowth of SARS-CoV-2 in Vero cells incubated with macrophages that interacted with COVID-19 non-survivors’ platelets in the presence or not of abciximab (10 μg/ml) also quantified by FISH-Flow. Results are expressed as % of SARS-CoV-2 RNA+/dsRNA+ Vero cells in the two conditions. The % inhibition of Vero cell infection in the presence of abciximab is indicated, with asterisk corresponding to statistical significance in the comparison between the two groups (Student T-test)

