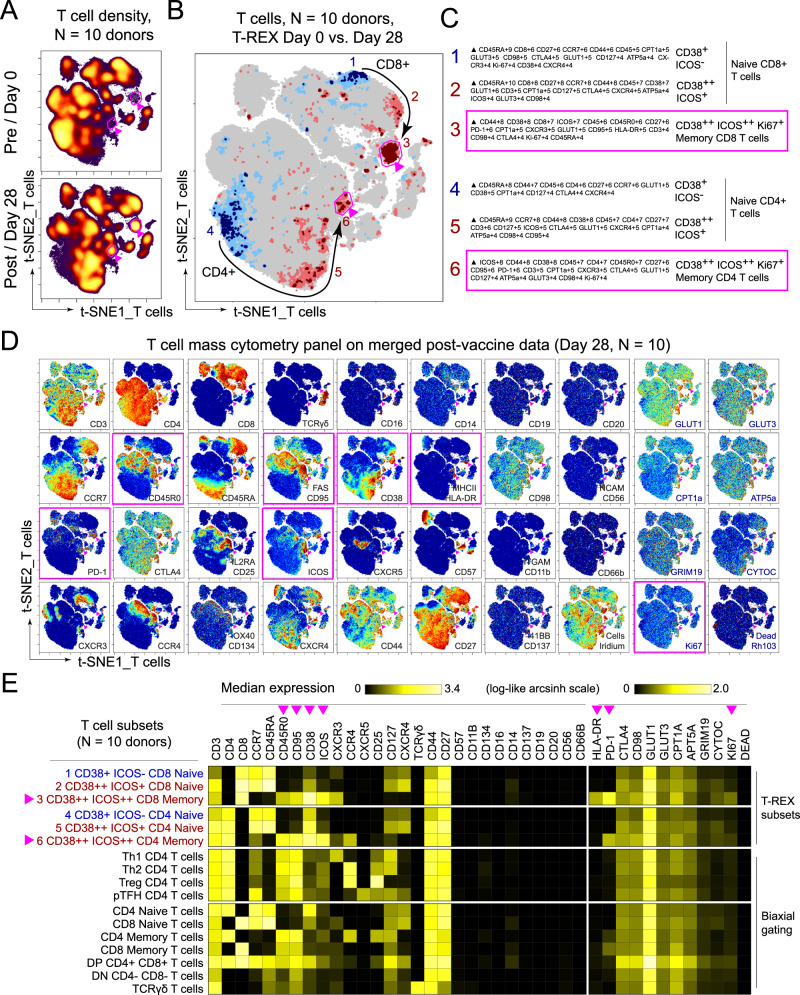
Fig. 2. Immune phenotyping of BNT162b2 responding T cells.
PBMCs collected from study participants (n = 10) pre-vaccination (day 0), and day 28 post-vaccination (7 days post-boost) were analyzed individually by mass cytometry in one setting to avoid batch effects, and data were concatenated for analysis. A CD3+ T cells from 10 participants were pooled into two sets, one for pre-vaccination (taken at day 0) and one for post-vaccination (day 28). Cell density for each set is shown on the t-SNE axes. B T-REX analysis of the CD3+ T cells from the 10 participants is shown. A central t-SNE, performed only using cell surface markers, shaded by T-REX change depicts phenotypically similar cells in regions of great expansion (dark red, ≥95% from post-vaccination day 28) or great contraction (dark blue, ≥95% from pre-) over time following SARS-CoV-2 vaccination. Red or blue population interpretations are shown for major expanding or contracting populations identified by T-REX. C MEM labels show enriched protein features for several populations of great expansion or contraction. All measured features were included in MEM enrichment labels, which only show features enriched by at least +4 on a scale from 0 to 10. Pink boxes are around the MEM labels for the CD4+ and CD8+ memory T-cell clusters that are greatly enriched for ICOS and CD38 protein and expanded greatly following vaccination. D Each protein marker is shown on t-SNE axes, with proteins that were enriched on CD4+ICOS+CD38+ and CD8+ICOS+CD38+ cells in pink boxes. A rainbow intensity scale indicates expression levels with red representing high and dark blue representing low expression. Protein names in blue indicate functional features that were not used in t-SNE analysis, including metabolic markers, Rhodium, and Ki67. Surface proteins in black were used in t-SNE analysis. E Heat maps show all markers measured by mass cytometry for cell populations as determined by T-REX or expert gating. Cell labels in red were defined by T-REX as expanding and blue were defined as contracting by T-REX. Black cell labels were expert gated. Protein markers enriched in CD4+ICOS+CD38+ and CD8+ICOS+CD38+ cells are indicated with pink arrows.

