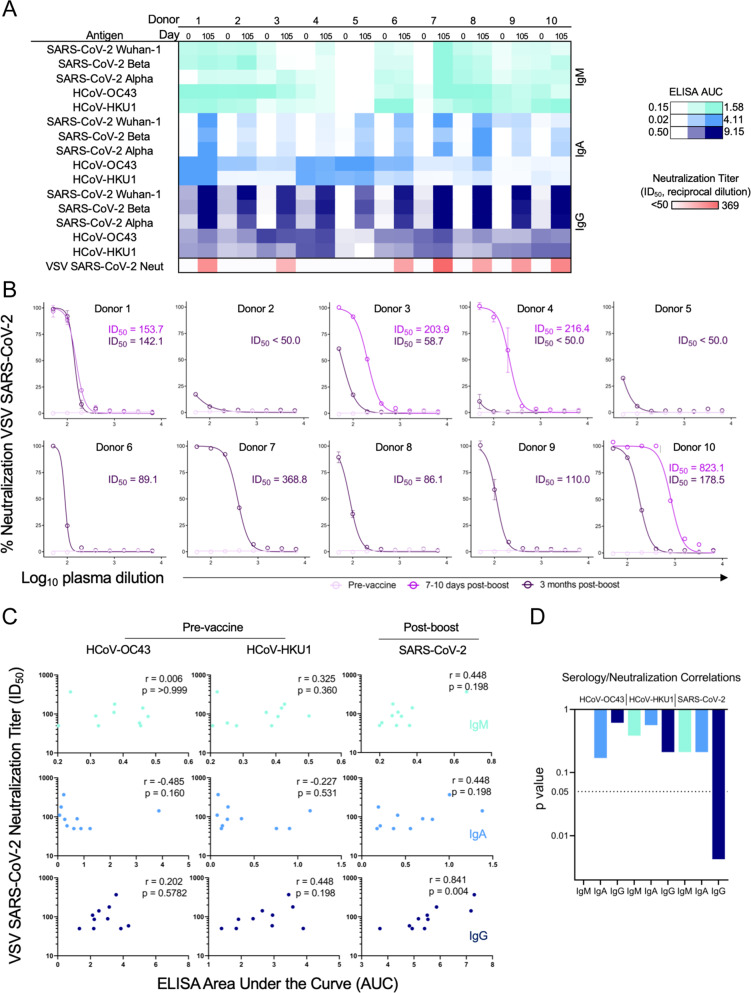
Fig. 5. Serologic response induced by BNT162b2.
Sera were analyzed from healthy participants (n = 10) pre-vaccination and at day 105 in one setting to avoid batch variation. A Log ELISA area under the curve (AUC) values from vaccine recipient plasma are depicted as a heatmap against spike proteins from SARS-CoV-2 Wuhan-1, SARS-CoV-2 Alpha, SARS-CoV-2 Beta, HCoV-OC43, and HCoV-HKU1 coronaviruses. The minimum signal is represented in white and the maximum signal is depicted by teal, blue, and navy blue for IgM, IgA, and IgG, respectively. At the bottom of the serology heatmap, the inhibitory dose at 50% neutralization (ID50) neutralization titer at the day 105 time point is depicted from zero neutralization (white) to the maximum Log ID50 value quantified in the participants. ELISAs were performed in technical duplicate and repeated once; neutralization assays were performed once in technical triplicate. B VSV SARS-CoV-2 neutralization curves of vaccine recipient plasma. Pre-vaccine, 7–10 days post-boost (collected only from participants 1, 3, 4, and 10), and 105 days post-boost are depicted in light pink, pink, and purple, respectively. %Neutralization (y-axis) is plotted as a function of log plasma dilution (x axis). Assays were done in technical triplicate. C Spearman correlations for serological responses as log ELISA AUC (x-axis) of patient cohort against pre-vaccination HCoV-OC43 (left), HCoV-HKU1 (middle), and post-boost SARS-CoV-2 (right) as a function of neutralization titer expressed as ID50 (y axis). IgM is depicted in teal (top), IgA is shown in blue (middle), and IgG is shown in navy blue (bottom). The respective rho and p values are shown in the top right of each plot. D Individual statistical significance comparison values are depicted as a bar graph for HCoV-OC43, HCoV-HKU1, and SARS-CoV-2 (left to right). IgM is depicted in teal, IgA is shown in blue, and IgG is shown in navy blue. All error bars are mean ± standard deviation.

