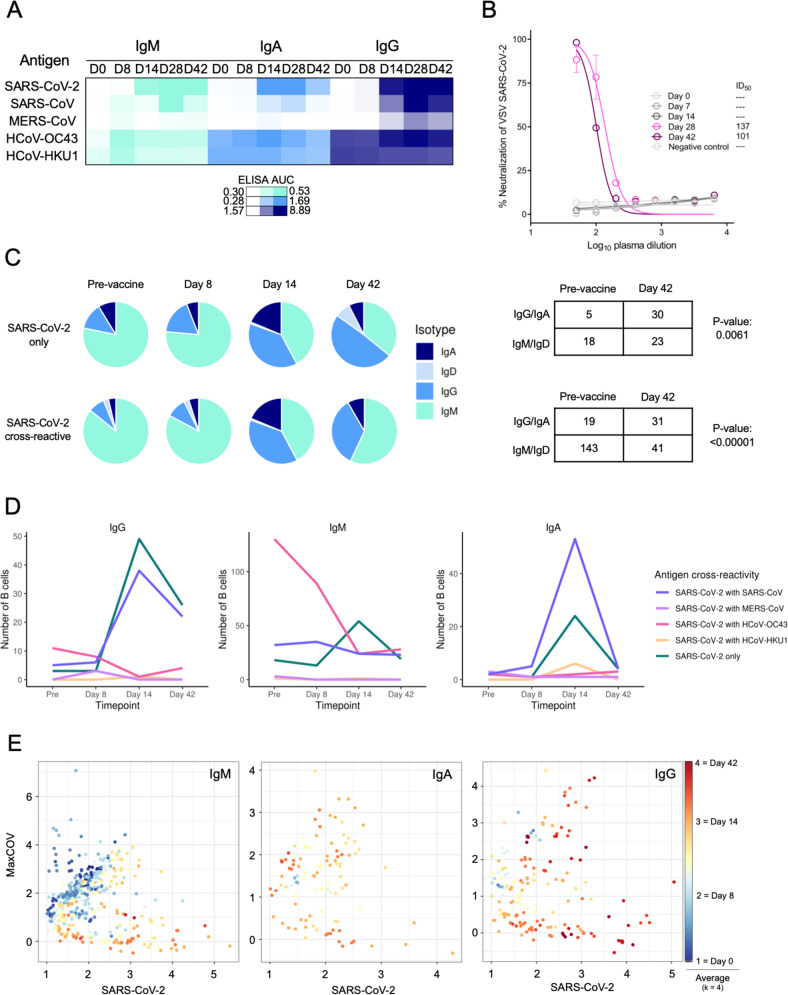
Fig. 6. LIBRA-seq characterization of the antigen specificity of the SARS-CoV-2-reactive B-cell response to BNT162b2.
A single participant with multiple longitudinal samples was analyzed for serological response and individual B-cell selectivity by LIBRA-seq. A Plasma log ELISA area under the curve (AUC) values are depicted as a heatmap against spike proteins for SARS-CoV-2, SARS-CoV, MERS-CoV, HCoV-OC43, and HCoV-HKU1. The minimum signal is represented in white and the maximum signal is depicted by teal, blue, and navy blue for IgM, IgA, and IgG, respectively. Assays were performed in technical duplicates and repeated once. B VSV SARS-CoV-2 neutralization of longitudinal timepoints. % Neutralization (y-axis) is plotted as a function of plasma dilution (x axis). The negative control sample, Day 0, Day 8, and Day 14 timepoints are depicted in gray, with Day 28 and Day 42 curves shown in pink and purple respectively. The inhibitory dose at 50% neutralization (ID50) values of each timepoint is denoted to the right of graph. Assays were performed in technical triplicate and performed once. C Pie charts representing: (top) SARS-CoV-2-specific B cells with an associated LIBRA-seq score ≥1 for SARS-CoV-2; and (bottom) SARS-CoV-2 cross-reactive B cells (bottom) with an associated LIBRA-seq score ≥1 for SARS-CoV-2 and for at least one other coronavirus antigen (MERS-CoV, SARS-CoV, HCoV-OC43, or HCoV-HKU1). For the pre-vaccine, day 8, day 14, and day 42 time points, the segments in each pie chart represent the number of antibody sequences with the isotypes IgD (light blue), IgM (teal), IgG (blue), IgA (navy blue). Also shown are a statistical comparison of isotype distribution of SARS-CoV-2-specific (top) and SARS-CoV-2 cross-reactive (bottom) B cells in the pre-vaccine and day 42 post-vaccination time points. The values in each table represent the number of antibody sequences with the designated isotypes. D Evolution of cross-reactive SARS-CoV-2 and SARS-CoV-2-only B cells from each isotype (separate plots) over time. Each line shows the number of B cells (y axis) for either SARS-CoV-2-only (blue) or SARS-CoV-2 cross-reactive with other coronaviruses (designated colors) B cells at the four timepoints (x axis). E Individual IgM, IgA, and IgG-expressing cells graphed for cumulative cross-reactive (MaxCOV) and SARS-CoV-2 LIBRA-seq scores shaded based on k = 4 nearest neighbors averaging for the time of sample collection. All error bars are mean ± standard deviation.

