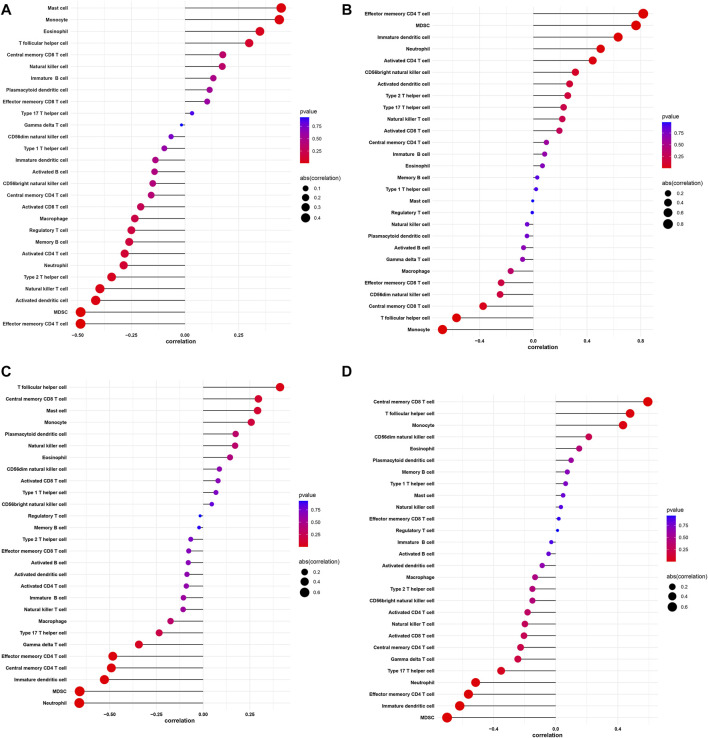
FIGURE 10.
Correlation between DAAM1, SDC4, STC2, NOX4 and infiltrating immune cells. (A) Correlation between DAAM1 and infiltrating immune cells. (B) Correlation between SDC4 and infiltrating immune cells. (C) Correlation between STC2 and infiltrating immune cells. (D) Correlation between NOX4 and infiltrating immune cells. The size of the dots represents the strength of the correlation between genes and immune cells; the larger the dots, the stronger the correlation, and the smaller the dots, the weaker the correlation. The color of the dots represents the p-value, the redder the color, the lower the p-value, and the bluer the color, the larger the p-value.

