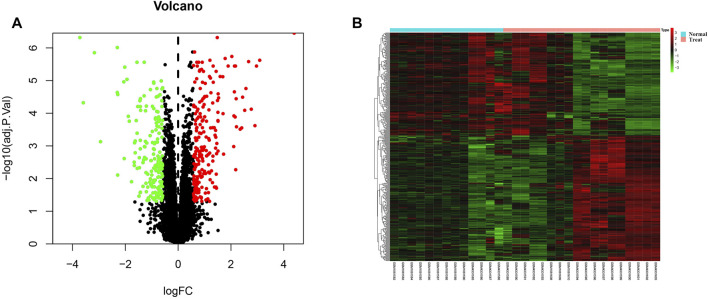
FIGURE 3.
Identification of differentially expressed genes. (A) Volcano plot for all genes, the green dot represent the down-regulated genes, red dot indicated the up-regulated genes, while the black genes showed the non-significant genes. (B) The differentially expression genes were plotted by a heatmap, the bright red bar indicated the higher gene expression level, while the bright green indicated the lower gene expression level.

