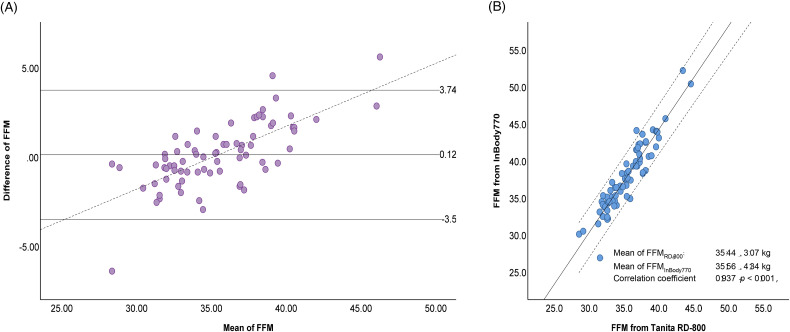
Figure 2.
Fat-free mass (FFM) estimated by Tanita RD-800 and InBody 770. (A) Bland-Altman plot; mean difference (95% limits of agreement (± 2SD)) 0.12 (−3.5, 3.74) kg. The dotted line represents the regression line between mean FFM Tanita RD-800 and FFM InBody 770 and difference between FFM Tanita RD-800 and FFM InBody 770 (r = 0.711, P < .001). (B) Scatter plots (R2 = 0.874, SEE = 1.09628).
Abbreviations: SD, standard deviation; R2, R squared; SEE, standard error of the estimate.

