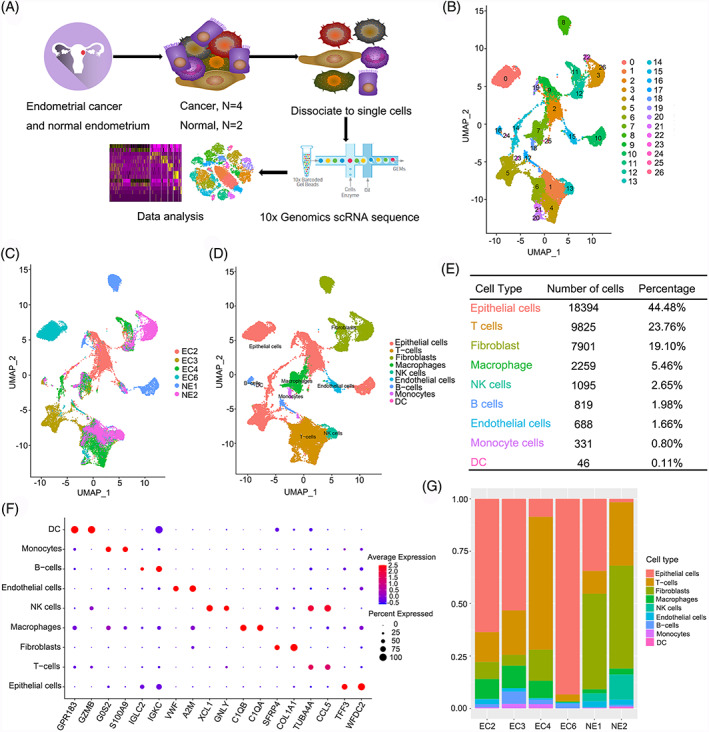
FIGURE 1.

Comprehensive overview of human endometrial cancer. (A) Schematic diagram of scRNA‐seq analysis workflow; (B) UMAP plotting of the 41,358 cells showing 27 cell clusters; (C) The sample origin of the cells; (D) The distinct cell types identified by marker genes; (E) The number of cells in each cell type; (F) Bubble plots showing marker genes for 9 distinct cell types; (G) Bar plots showing the proportion of cell types in each sample
