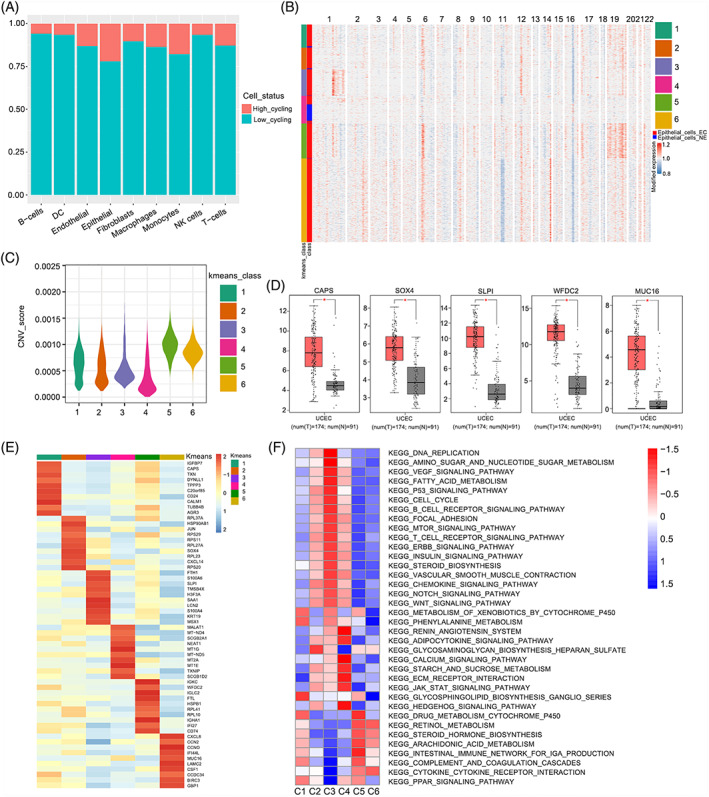
FIGURE 2.

Transcriptomic heterogeneity of malignant cells in EC. (A) The cell cycling status of distinct cell types; (B) The heatmap of the relative expression density of genes on each chromosome by comparing the tumour cell genome with a series of normal cell reference genomes; (C) The CNV scores of each k‐means class; (D) The expression level of marker gene in TCGA dataset, (*p < 0.05); (E) Heatmap of DEGs in each k‐means class; (F) Differences in pathway activity (scored per cell by GSVA) in 6 epithelial cell sub‐clusters
