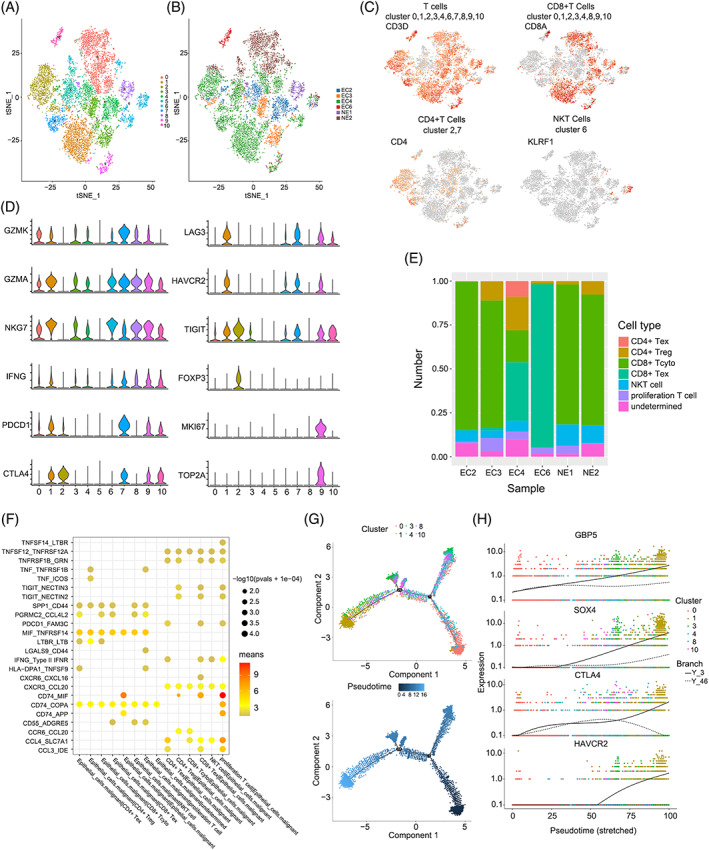
FIGURE 3.

Profiling of immune microenvironment in EC and intratumoral crosstalk with malignant cells. (A) t‐SNE plotting of the T cells showing 11 cell clusters; (B) The sample origin of the cells; (C) t‐SNE plots of marker genes for each cell type as indicated; (D) Violin plots of selected cytotoxicity, proliferation, and suppressive genes in distinct T cell subclusters; (E) Bar plots showing the proportion of cell types in each sample; (F) Interaction analysis showing enriched receptor‐ligand pairs in subsets of T cells and malignant cells; (G) Trajectory of differentiation from CD8+ Tcyto into Tex predicted by monocle 2; (H) Significantly up‐regulated genes in the differentiation process coloured by cell clusters
