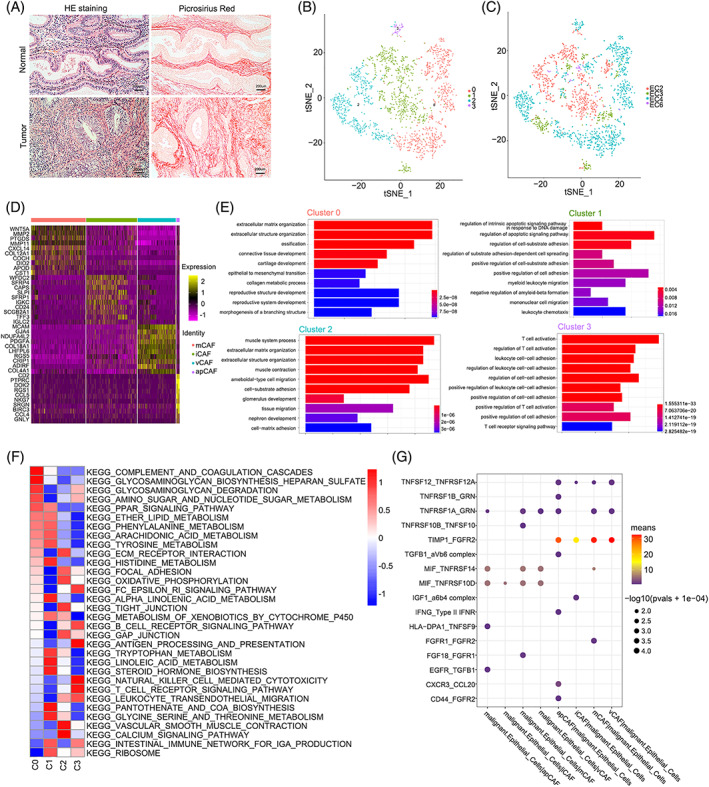
FIGURE 4.

Distinct cancer‐associated fibroblasts subpopulations detected in human EC. (A) H&E, picrosirius red staining in EC and normal tissues; (B) t‐SNE plotting of the cancer‐associated fibroblasts (CAFs) showing 4 cell clusters; (C) The sample origin of the cells; (D) Heatmap showing the top 10 DEGs (Wilcoxon test) for each cluster; (E) GO analysis of DEGs in distinct CAF subclusters; (F) GSVA analysis revealing the hallmark pathways in distinct CAF subclusters; (G) Dot plot showing receptor‐ligand pair analysis of the interactions between malignant cells and distinct cell types
