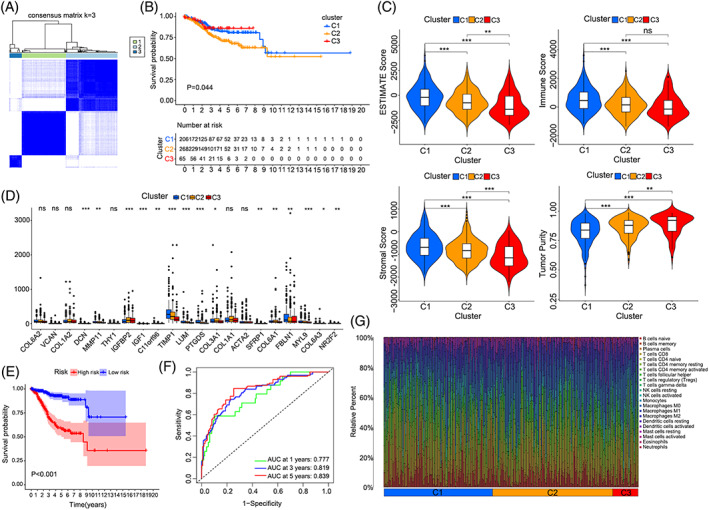
FIGURE 5.

Prognostic significance of vCAF. (A) Heatmap showing the clustering result for the value of consensus clustering based on the vCAF markers; (B) Kaplan‐Meier survival analysis of tumour samples grouped in A; (C) Violin plots showing the estimated scores of TME in each cluster, (*p < 0.05, **p < 0.01, ***p < 0.001); (D) The expression level of classic stroma markers in each cluster; (E) Kaplan‐Meier survival curve of the prognostic model for TCGA EC patients; (F) Time‐dependent ROC curves of the prognostic model for 1‐,3‐ and 5‐year overall survival in EC; (G) The infiltrating immune cells in different cluster
