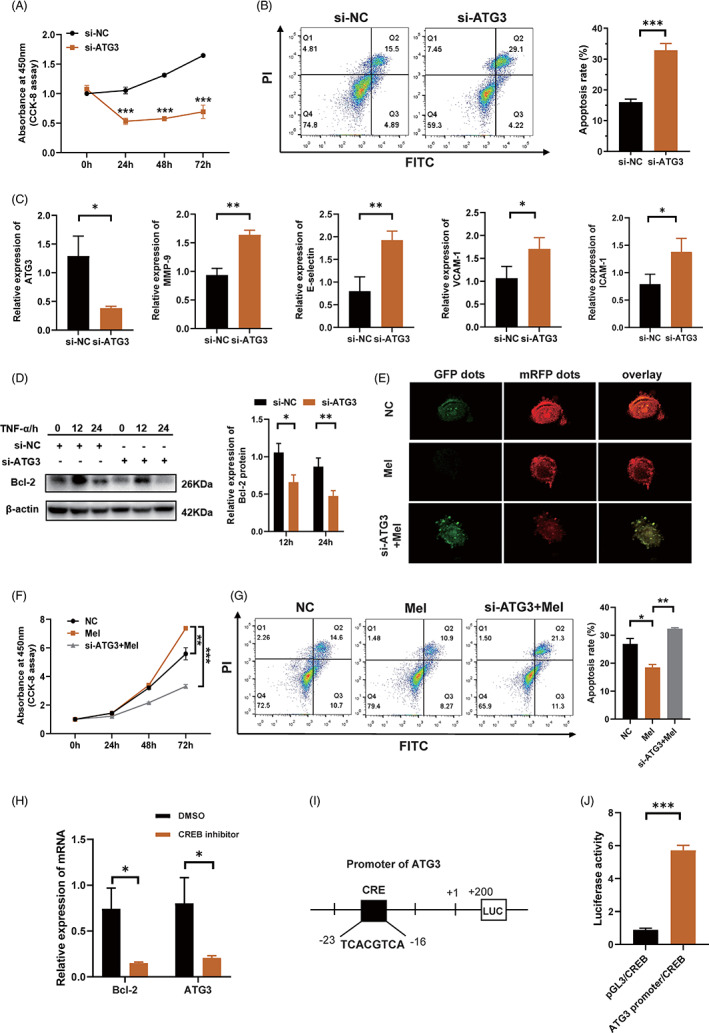
FIGURE 4.

MT/CREB/ATG3 pathway is responsible for melatonin‐repressed apoptosis in HCAECs, in an autophagy‐dependent manner. (A) Cell proliferation of HCAECs, with or without ATG3 knockdown, as assessed using CCK‐8 assay. (B) Cell apoptosis of HCAECs, with or without ATG3 knockdown, was examined by means of Annexin V‐FITC/PI double‐staining and flow cytometry. Cell percentages in the Q3 and Q2 quadrants (indicating the fraction of apoptotic cells) were calculated, and are presented as histograms. (C) Relative expression of ATG3, MMP‐9, E‐selectin, VCAM‐1, and ICAM‐1 after ATG3‐knockdown in HCAECs, as analysed using RT‐qPCR. (D) Western blot showing the expression of Bcl‐2 in ATG3‐deficient HCAECs. (E) Kinetics of autophagic flux was detected using a fluorescence microscope, after the HCAECs were infected with an adenoviral vector expressing mRFP‐GFP‐LC3. (F) Cell proliferation of HCAECs was assessed using CCK‐8 assay. Mel, melatonin group (melatonin, 0.5 mM, 6 h); si‐ATG3+Mel, melatonin treatment after silencing of ATG3; NC, negative control. (G) Cell apoptosis of HCAECs, as assessed using flow cytometry. (H) Relative expression of ATG3 in the presence of CREB inhibitor, as analysed using RT‐qPCR. BCL2 served as a positive reference. (I) ATG3 promoter sequence with CREB binding site. (J) Luciferase activity of 293 T cells co‐transfected with CREB‐CDS vector or vector carrying ATG3 promoter sequence, or co‐transfected with CREB‐CDS vector and blank vector without ATG3 promoter sequence. Data are presented as mean ± SEM. *p < 0.05, **p < 0.01, and ***p < 0.001; ns, not significant. ATG3, autophagy‐related gene‐3; CDS, coding sequence; CREB, cAMP‐response element binding protein; GFP, green fluorescent protein; ICAM‐1, intercellular cell adhesion molecule‐1; MMP‐9, matrix metalloproteinase 9; mRFP, monomeric red fluorescent protein; MT, melatonin receptor; VCAM‐1, vascular cell adhesion molecule‐1
