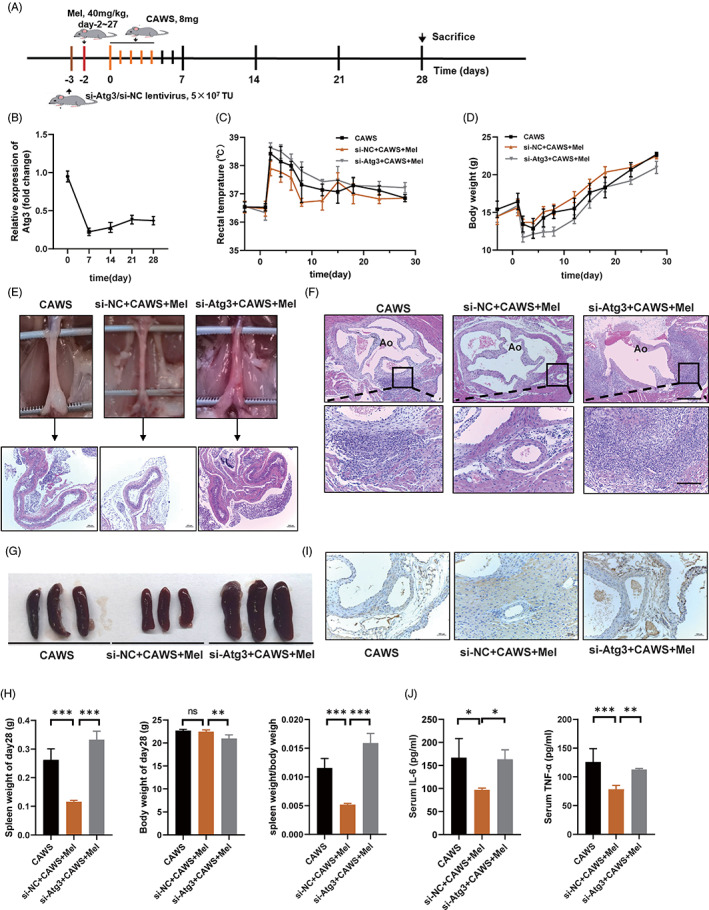
FIGURE 5.

ATG3 deficiency blocks the protective effects of melatonin in the KD mouse model. (A) Modelling timeline for the CAWS (CAWS, 8 mg), si‐NC+CAWS+melatonin (melatonin, 40 mg/kg), and si‐Atg3+CAWS+melatonin groups. (B) Relative expression of Atg3 in the heart tissues of mice after Atg3‐knockdown, as analysed using RT‐qPCR. (C) Daily change of rectal temperature of mice in the CAWS, si‐NC+CAWS+melatonin, and si‐Atg3+CAWS+melatonin groups. (D) Daily change of body weight of mice in the CAWS, si‐NC+CAWS+melatonin, and si‐Atg3+CAWS+melatonin groups. (E) H&E staining of the abdominal aorta. Scale bar: 200 μm. (F) H&E staining of the aortic root. The scale bar of the upper pictures is 200 μm, while that of the bottom pictures is 50 μm. (G) Representative images of spleens of mice on day 28. (H) Spleen weights, body weights, and the ratio of the two on day 28. (I) Immunohistochemistry showing the expression of Bcl‐2 in the coronary arteries of mice. (J) Serum concentrations of TNF‐α and IL‐6 in the mice on day 14, as detected using ELISA. Data are presented as mean ± SEM. *p < 0.05, **p < 0.01, and ***p < 0.001; ns, not significant. Atg3, autophagy‐related gene‐3; CAWS, Candida albicans water‐soluble fraction; KD, Kawasaki disease; NC, negative control
