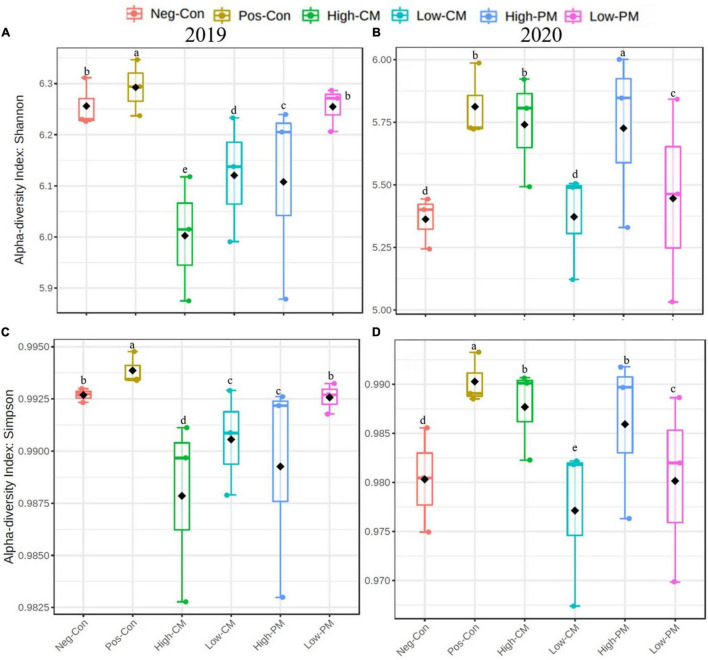
FIGURE 1.
Comparison of the soil bacterial communities based on PCR-amplified 16S rRNA gene analysis. Box plots for α-diversity estimated Shannon (A,B) and Simpson (C,D) indices of the bacterial community under six treatments. The ends of the whiskers represent minimum and maximum, the bottom and top of the box are the first and third quartiles, and the black dot inside the box is the median. Bars show the standard error of the mean, and bars with different letters are significantly different at P < 0.05. Please see Table 3 for the treatment combination.

