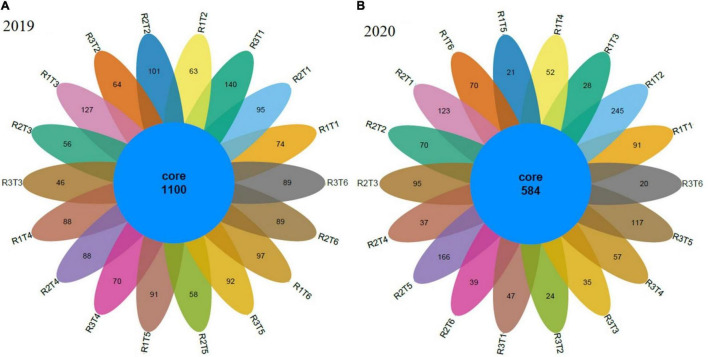
FIGURE 3.
Venn diagram showing the bacterial unique and operational units (OTUs) during 2019 (A) and 2020 (B) under organic and inorganic fertilization. Neg-Con (R1T1, R2T1, and R3T1), Pos-Con (R1T2, R2T2, and R3T2), High-CM (R1T3, R2T3, and R3T3), Low-CM (R1T4, R2T4, and R3T4), High-PM (R1T5, R2T5, and R3T5), and Low-PM (R1T6, R2T6, and R3T6). See Table 3 for the treatments combination.

