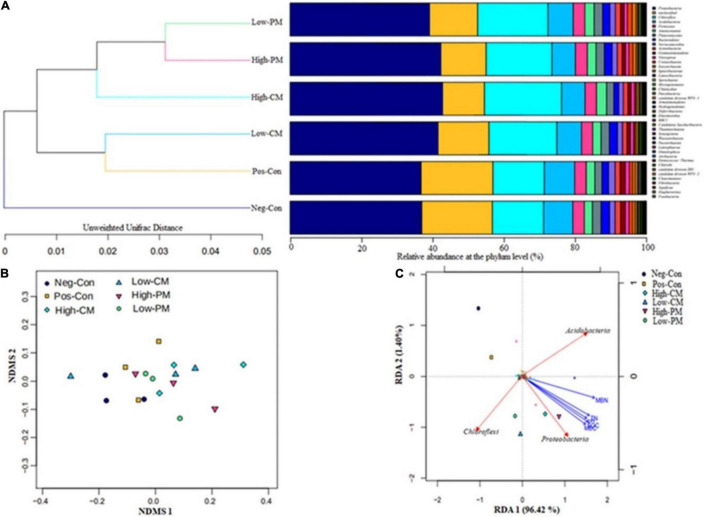
FIGURE 5.
The similarity between soil bacterial communities of different fertilizers treatments is confirmed by cluster analysis (A), NDMS analysis based on unweighted Unifrac distance at OTU levels (B), and redundancy ordination analysis (RDA) (C) showing the strength of association between the different treatments, environmental factors (represented by yellow arrows), and dominant bacteria at the phylum level (represented by red arrows). For fertilization treatment combination details, see Table 3.

