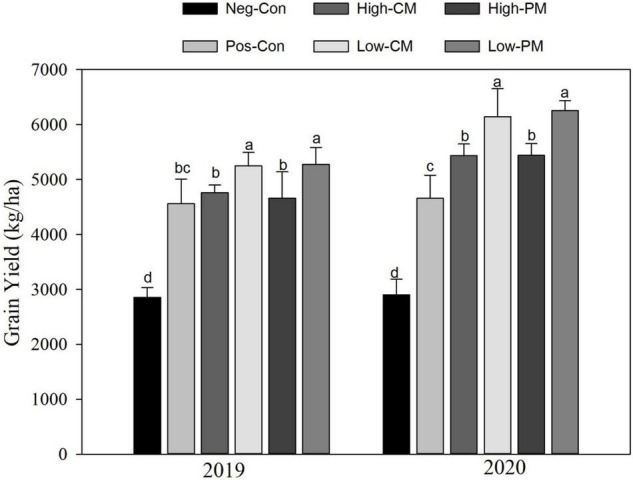
FIGURE 6.

Variation in rice yield as affected by organic and inorganic N application. The mean comparison was made using the Tukey’s post hoc test for treatments at 5%. Different letters on bars are not significantly different at P < 0.05. See Table 3 for treatments combination.
