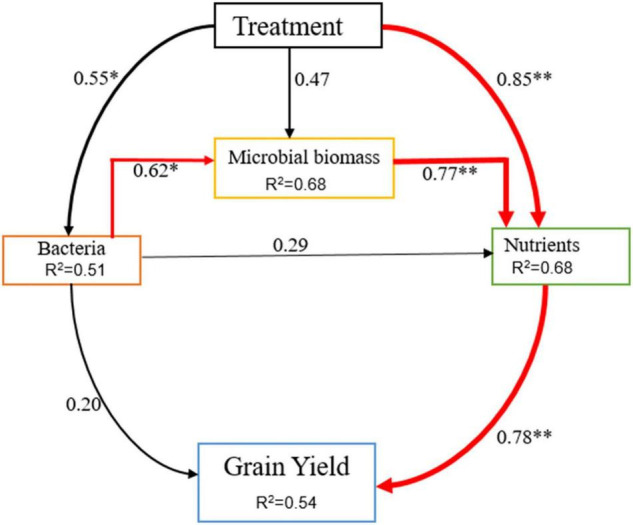
FIGURE 7.

The value above the structural equation model line shows the path coefficient. The red lines represent the positive path coefficient and the black lines represent the non-significant path coefficient. The width of the arrow indicates the significance of the standard path coefficient (**P < 0.01 and *P < 0.05).
