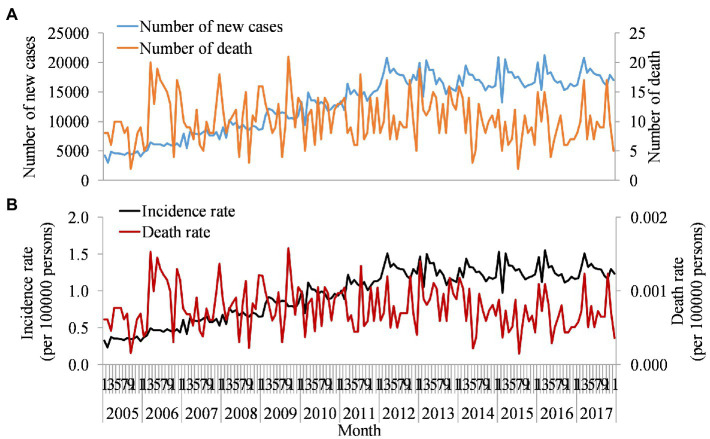
Figure 1.
Monthly reported number of new cases, deaths, incidence, and death rates of hepatitis C in China, 2005–2017. Orange line in plot (A) used left axis represents new cases, and blue line used left axis represents death cases of hepatitis C virus (HCV) per month reported by Chinese Centre for Disease Control and Prevention (CDC). Plot (B) is the rate calculated by new cases and death cases in plot (A) after adjusting for population.

