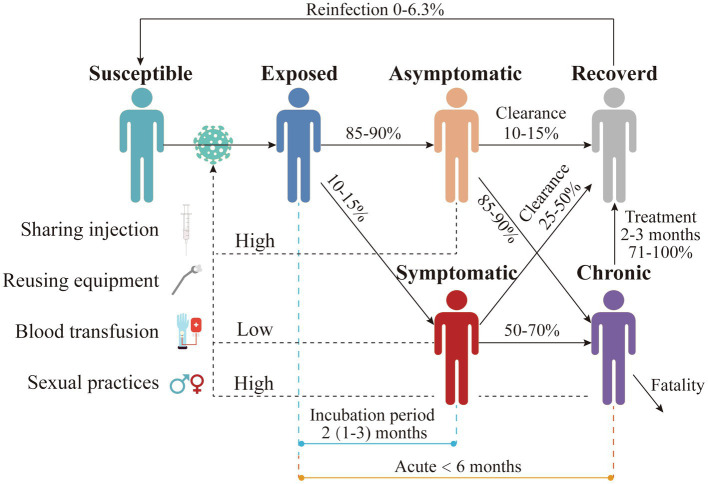
Figure 5.
Natural history of HCV infection in humans. People with different colors indicate the infection status of HCV. The solid lines represent the transition of each status, and the numbers above them represent the transition ratio or time. The dotted lines indicate the main transmission routes. “High” means the main transmission route, and “low” means the secondary route.

