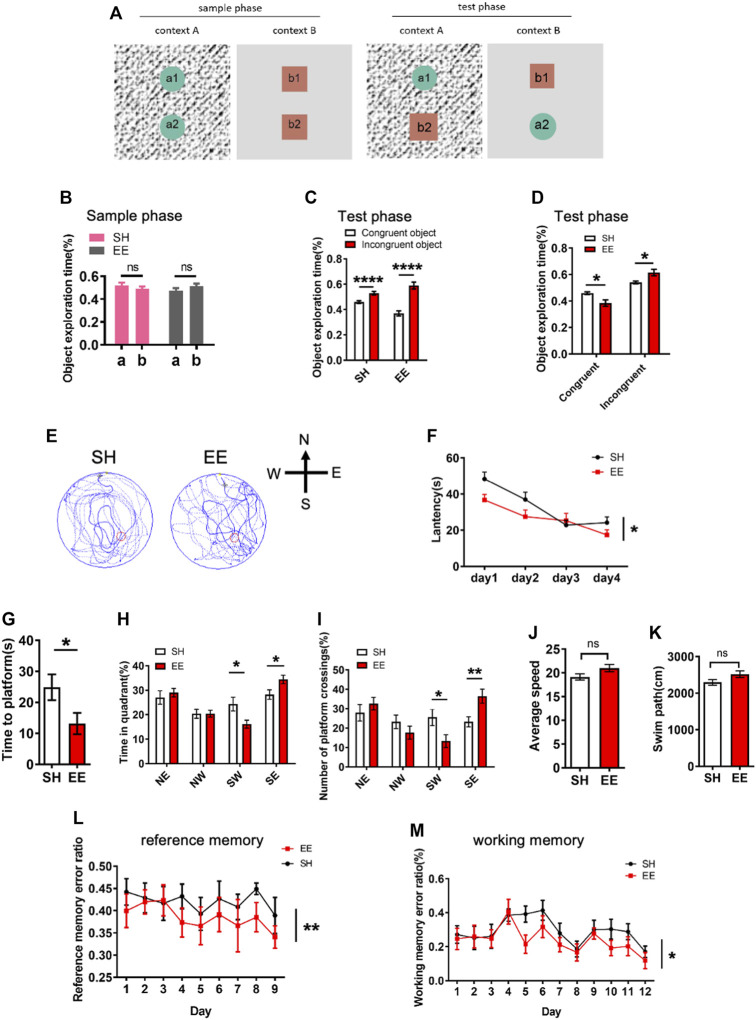
FIGURE 2.
Enriched environment exposure enhances the learning and memory of mice. (A) Schematic illustration of pattern separation memory test. In the sample phase, mice were sequentially exposed to two similar but distinct contexts one and two containing pairs of identical objects. In the test phase, mice were placed in either context one or two containing one congruent object and one incongruent object. (B) Pattern separation memory test showed that SH and EE mice did now show a difference in the proportion of object exploration time during the sample phase. EE mice, n = 14; SH mice, n = 12. Values represent mean ± SEM; ns, not significant; *p < 0.05; **p < 0.01; ***p < 0.001; unpaired Students t-test. (C,D) Pattern separation memory test showed that SH and EE mice spent a greater proportion of time exploring the incongruent object (C), but EE mice exhibit a higher proportion of time for an incongruent object (D) compared to SH mice during the test phase. EE mice, n = 14; SH mice, n = 12. Values represent mean ± SEM; *p < 0.05; **p < 0.01; ***p < 0.001; ****p < 0.0001; unpaired Students t-test. (E) Representative images of the swimming path of SH and EE mice during the testing period in the Morris Water Maze test. (F) EE mice displayed shorter escape latency compared to SH mice during the training period in the Morris Water Maze test. SH, n = 7 mice; EE, n = 8 mice. Values represent mean ± SEM; *p < 0.05; **p < 0.01; ***p < 0.001; ****p < 0.0001; unpaired Students t-test. (G–K) Probe trial test results showed that EE mice displayed a shorter time to reach the platform (G), longer time in the target quadrant field (H), and more numbers of platform crossings (I), while SH and EE mice exhibited similar swimming speed (J) and length (K). SH, n = 7 mice; EE, n = 8 mice. Values represent mean ± SEM; *p < 0.05; **p < 0.01; ***p < 0.001; ****p < 0.0001; unpaired Students t-test. (L,M) Eight-arm maze test results showed that EE mice displayed lower error ratios of reference (L) and working (M) memory. SH, n = 7 mice; EE, n = 8 mice. Values represent mean ± SEM; *p < 0.05; **p < 0.01; ***p < 0.001; ****p < 0.0001; unpaired Students t-test.

