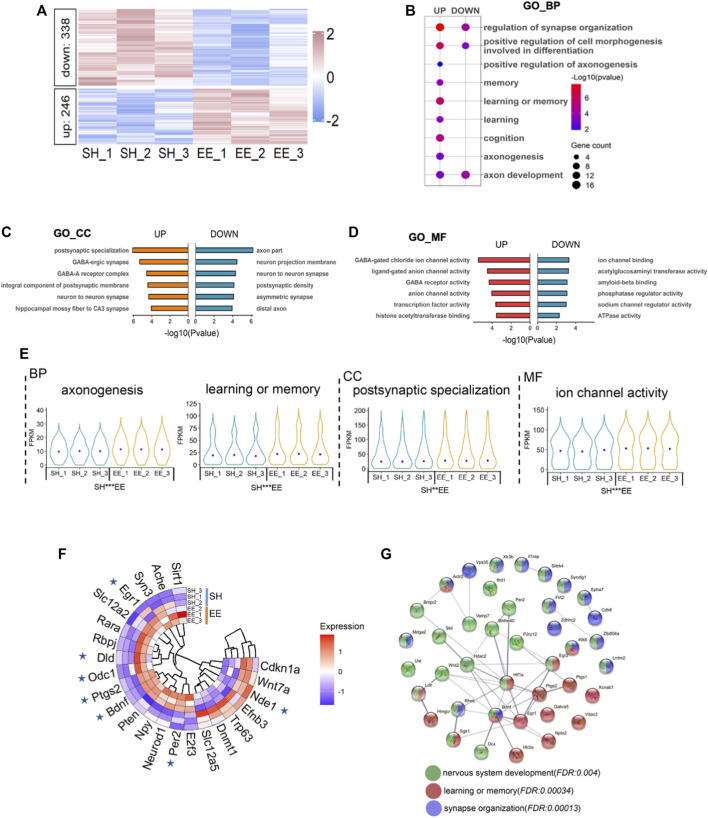
FIGURE 3.
Enriched environment exposure leads to the altered transcriptome. (A) Heatmap illustrating the altered transcriptome in EE mice compared to SH mice. Red color, up-regulated genes; blue color, down-regulated genes. Three biological repeating brain samples of SH and EE mice were adopted for sequencing. (B) GO analysis of the up- and down-regulated genes revealed enrichment for biological process terms related to synapse organization, axon development, learning, and memory. (C,D) GO cell component (GO_CC) (C) and GO molecular function (GO_MF) enrichment analysis showed that differential expressed genes (DEGs) involve in synapse activity, especially GABAergic synapse. (E) Violin plots showed that up-regulated genes in the EE group significantly enriched in the indicated GO terms compared to the SH group. *p < 0.05; **p < 0.01; ***p < 0.001; unpaired Students t-test. (F) Twenty-three genes in the MANGO database were revealed by our RNA-seq. Seven genes, six up- and one down-regulated, exhibited altered expression. (G) The interaction analysis showed up-regulated genes related to neuronal development (green), learning and memory (red), and synapse organization (purple).

